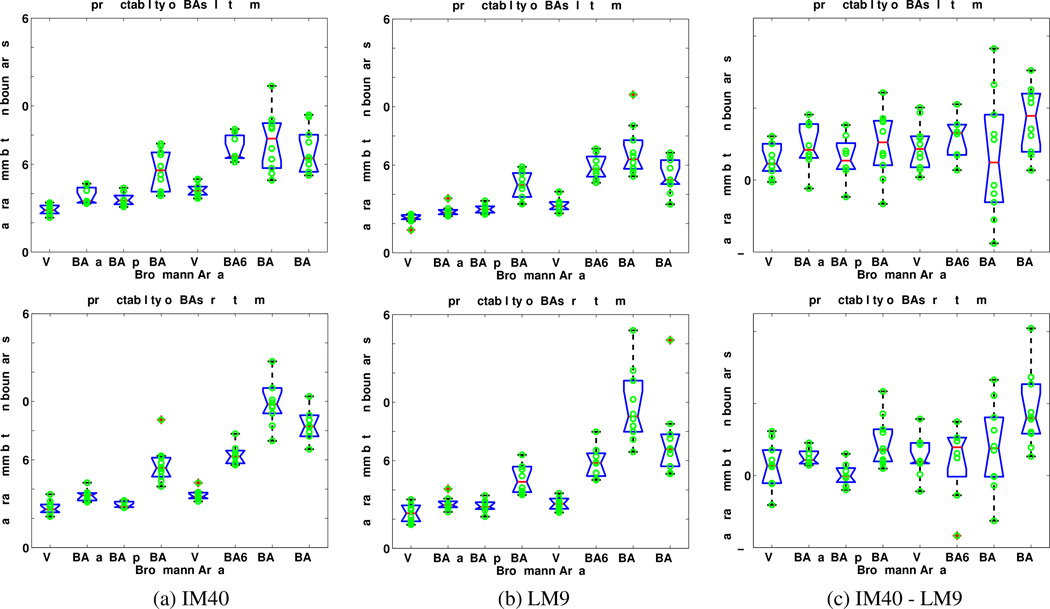
Figure 5.
Box plots of the modified Hausdorff distances for 8 Brodmann areas for the image-matched atlas IM40 and the label-matched atlas LM9. (Top row) Left Hemispheres. (Bottom row) Right Hemispheres. (a) IM40. (b) LM9. (c) Difference between the alignment errors of IM40 and LM9. Positive values indicate that LM9 yields better results. Blue boxes indicate lower and upper quartiles, red lines are medians. Dotted lines extend 1.5 times the inter-quartile spacing. Data points outside of the lines are considered outliers.

