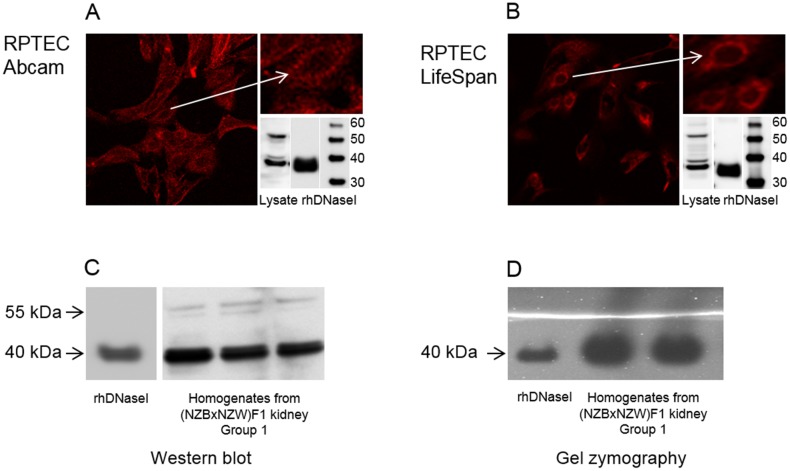
Fig 2. Characterization of DNaseI protein expression pattern in resting tubular cells and (NZBxNZW)F1 kidney homogenates.
Patterns of immunofluorescence staining of human renal proximal tubule epithelial cells (RPTEC) and western blot analyses of RPTEC lysates are demonstrated (A and B). Anti-DNaseI antibodies from Abcam (A) and LifeSpan (B) predominantly stain cytoplasm and recognize two dominant bands: a strong 40 kDa band and a weaker 55 kDa band by western blot (A, B). The same bands were detected in kidney homogenates isolated from pre-nephritic BW mice Group 1 (C). As demonstrated by zymography only the 40 kDa bands possessed DNaseI enzyme activity while no enzymatic activity was found in area corresponding to the 55 kDa band. Human recombinant DNaseI was used as a control for both western blot analysis and DNaseI zymography.

