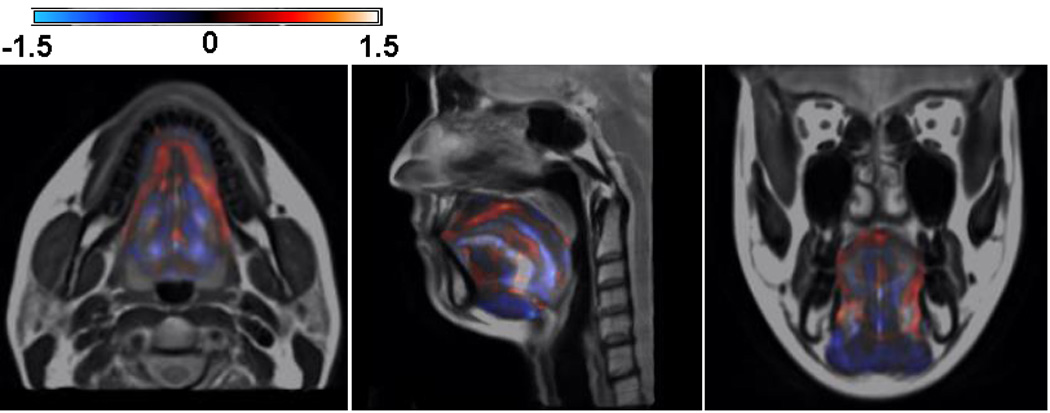
Figure 12.

Illustration of the log Jacobian map of Deformation I. The blue shows the tissue expansion and the red indicates the volume shrinkage relative to the atlas. It is clearly shown that log Jacobian map exhibits the volume and anatomical changes of each muscle during the atlas building.
