Figure 6.


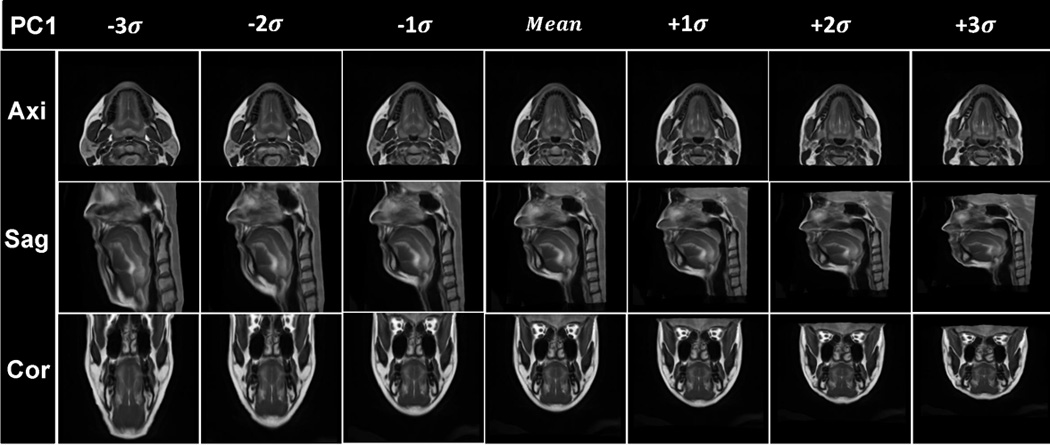
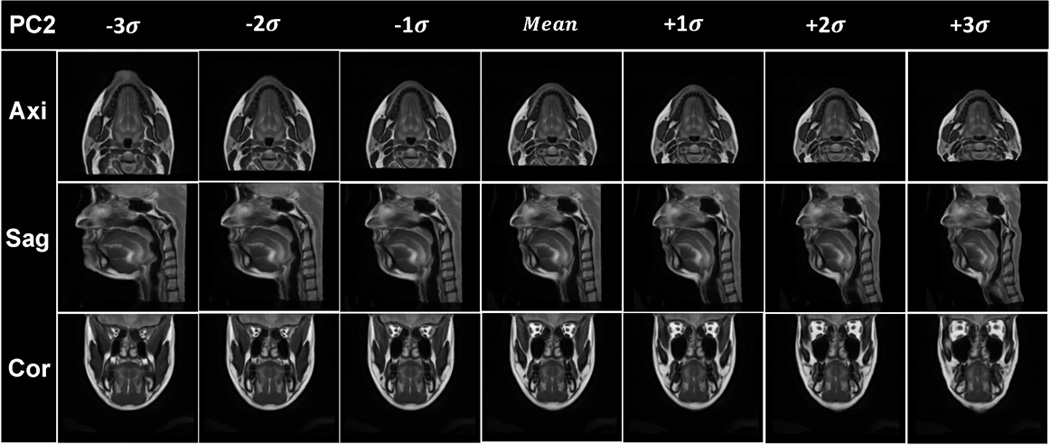
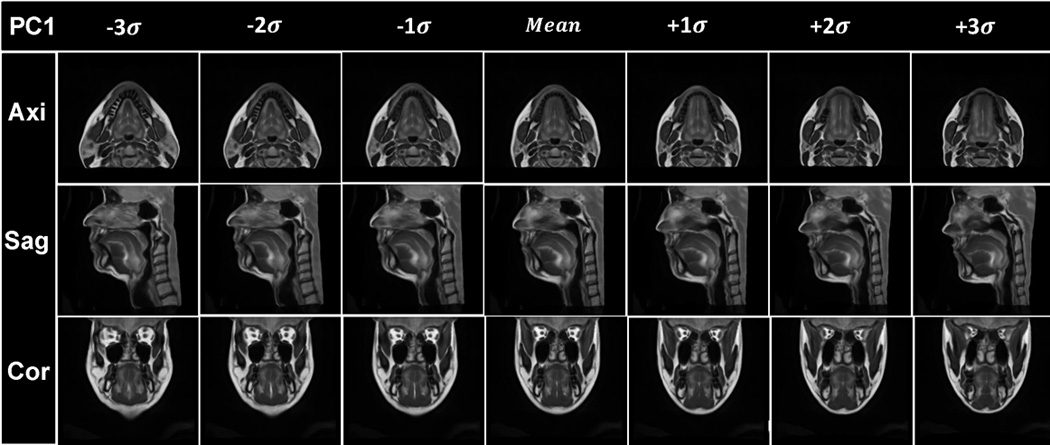
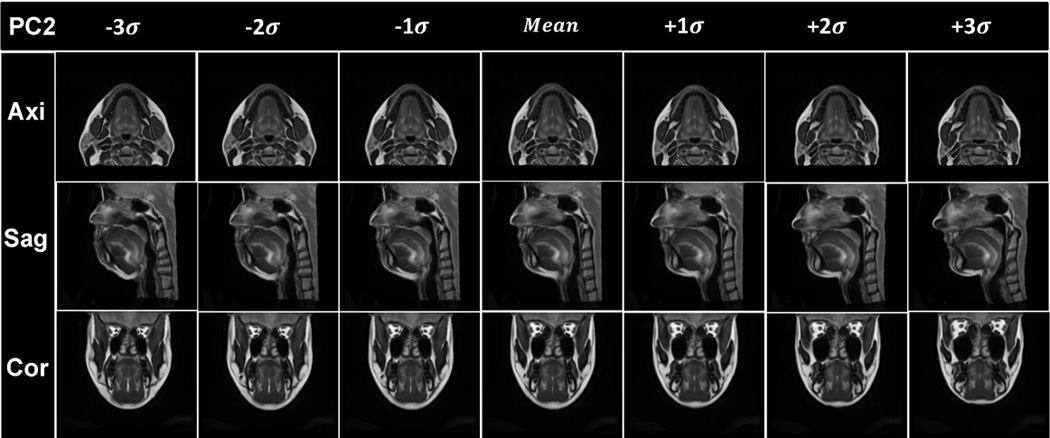
Visualization of the results of PCA analysis. The vocal tract atlas was warped by the first two PC’s using Deformations I and II. (a) PC1 of Deformation I shows variance in vertical length changes. (b) Atlas warping by PC2 of Deformation I shows variance in AP width. (c) Atlas warping by PC1 of Deformation II shows variance in the LR width. (d) Atlas warping by PC2 of Deformation II represents vertical differences in the posterior oral cavity. Deformation I represents the homogeneous plus local volume changes by removing the rigid transformations from the cascade of the affine transformation and local deformations (SyN) and Deformation II represents the local deformations only (SyN).
