
Fig. 3.
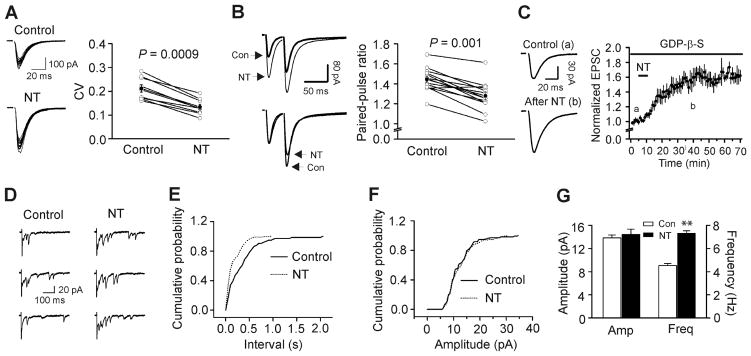
NT increases AMPA EPSCs by facilitating presynaptic glutamate release. A, NT reduced the coefficient of variation (CV=standard deviation/mean) of AMPA EPSCs. Standard deviation and mean were obtained by averaging 15 consecutive EPSCs. Left panel shows 15 consecutive EPSCs recorded before (upper) and after (lower) the application of NT. Right panel shows the calculated CVs from 9 cells (open circles) and their averages (solid circles). B, NT reduced paired-pulse ratio (PPR=P2/P1, P1 and P2 are the EPSCs evoked by two stimuli at an interval of 40 ms). Left upper, EPSCs averaged from ~20 current traces before (bold) and after (thin) the application of NT. Left lower, EPSCs recorded before and after the application of NT were scaled to the first EPSC. Note that the second EPSC after the application of NT is smaller than control. Right, PPRs recorded from 14 cells (open circles) and their averages (solid circles). C, Intracellular dialysis of GDP-β-S (4 mM) failed to block NT-mediated increases in AMPA EPSCs. D, Evoked AMPA EPSCs recorded from the same synapse in the presence of Sr2+ (6 mM) before and after application of NT. Note that AMPA EPSCs recorded as asynchronous events in the extracellular solution containing Sr2+ and application of NT increased the frequency of asynchronous events recorded in the presence of Sr2+. E, Cumulative frequency distribution of asynchronous EPSCs in the presence of Sr2+ before and after the application of NT. F, Cumulative amplitude distribution of asynchronous EPSCs in the presence of Sr2+ before and after the application of NT. G, Summarized asynchronous EPSC frequency and amplitude (n=6).