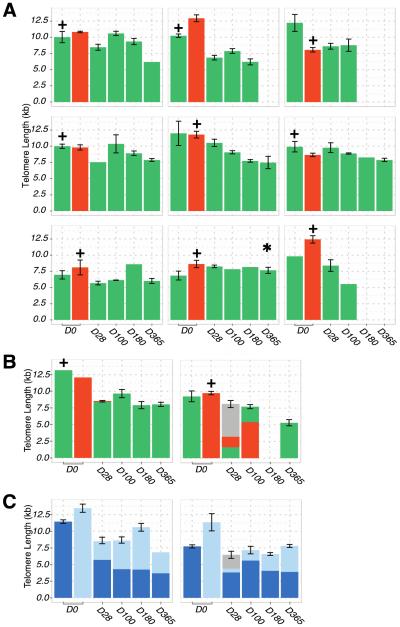
Figure 1.
Bar chart to show the TL in kb for each CB unit of 13 patients from the day of transplantation (Day 0) to last follow-up Patients were analyzed up to 1-year post-transplant or death (3 patients died prior to one year). The unit with the higher infused viable CD34+ dose per kilogram recipient body weight is indicated with a + sign above the unit on day zero. 1A. In 9 patients demonstrating complete single unit dominance as from 28 days after CBT, the unit responsible for sustained donor hematopoiesis is indicated in green whereas non-engrafting units are shown in red. Only one patient with complete unit dominance demonstrated TL maintenance post-transplant with a mean percentage TL gain of 11.5% (indicated with the asterix). 1B. Unit TL in 2 patients who displayed initial mixed chimerism but ultimate unit dominance (indicated in green). The proportions represent the contribution of each unit at that time-point with the grey indicating a transient contribution of host hematopoiesis. 1C. TL in 2 patients with complete donor engraftment but persistent mixed chimerism at 1-year post-CBT. Given the units co-engrafted and clear unit dominance could not assigned they are indicated in light and dark blue.

