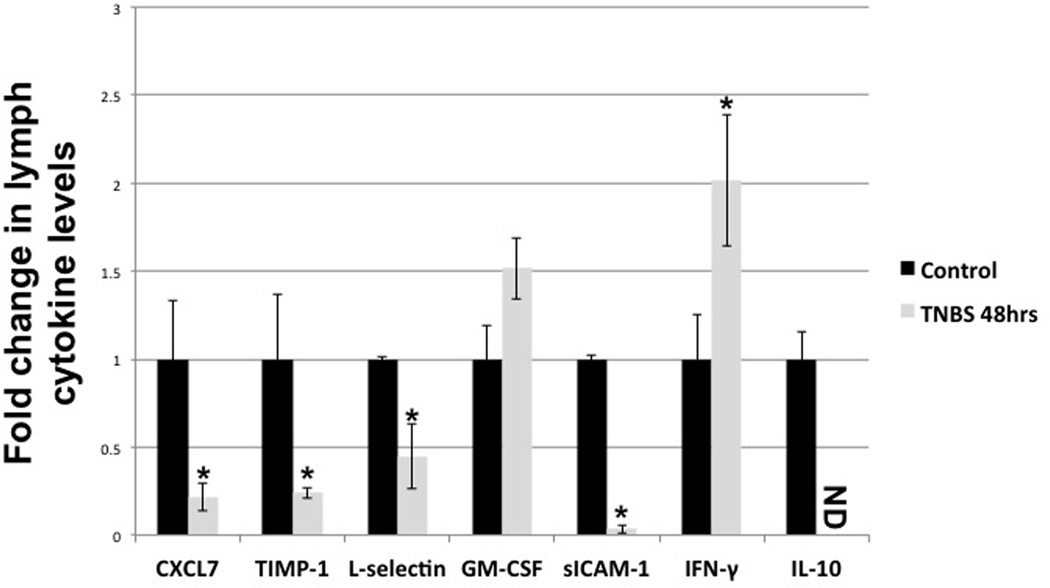
Figure 6.
Cytokine profile of lymph from control and 48hrs TNBS treated animals as detected by DotBlot assay. Lymph samples were collected from flow measurement experiments and centrifuged to remove cells. Statistical analysis was performed using ANOVA. n=5, ND=not detectable, bars=SE and * denotes p value ≤0.05

