Figure 5.
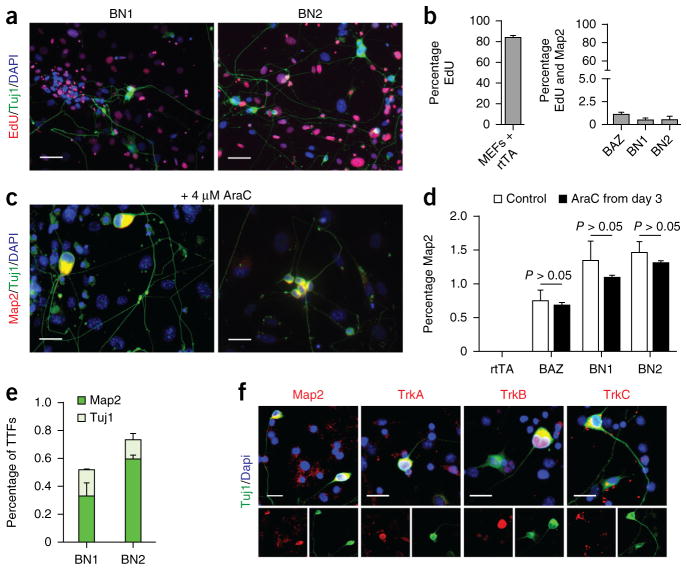
iSN reprogramming does not require proliferating or specialized embryonic precursor. (a) EdU and Map2 staining 14 d post induction. Scale bars represent 25 μm. (b) Quantification of the number of Map2-positive cells that co-stained for the mitotic indicator EdU. rtTA indicates MEFs infected with reverse tetracycline trans-activator. BAZ indicates MEFs infected with Brn2, Mash1 (also known as Ascl1) and Zic1, a previously reported transcriptional cocktail for the direct conversion of MEFs to neurons26. Bar are means from two separate experiments. Error bars are s.e.m. For each condition, 50,000 cells were counted in three biological replicates. (c) BN1 and BN2 generated neurons in the presence of the mitotic inhibitor AraC. AraC was applied from 3 d post induction until the end of the experiment at 4 μM, a concentration empirically determined to inhibit >90% proliferative cells. Scale bars represent 25 μm. (d) No significant difference was observed in the number of Map2-positive neurons generated in the presence or absence of the mitotic inhibitor AraC (BAZ, P = 0.19; BN1, P = 0.49; BN2, P = 0.40). Bars are means of two independent experiments. Error bars are s.e.m. For each condition, 50,000 cells were counted in three biological replicates. (e) Quantification of Map2-, Tuj1-positive cells induced from tail-tip fibroblasts. n = 50,000 cells per genotype from two independent experiments. Error bars represent s.e.m. for each condition. (f) BN1 and BN2 induced neural cells from TTFs that stain for peripheral sensory markers. Scale bars represent 25 μm.

