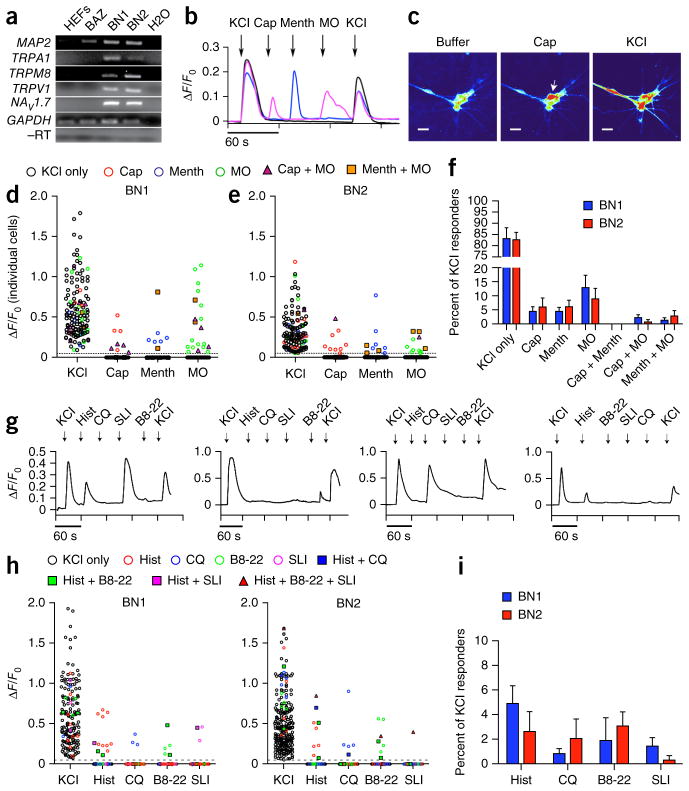
Figure 8.
Human iSNs possess functional properties of sensory neurons. (a) RT-PCR analysis showing presence of ligand gated calcium channels TRPA1, TRPM8, TRPV1 and the voltage-gated sodium channel NaV1.7 in BN1 and BN2 human iSNs compared with BAZ and uninfected controls (HEFs) at 16 d post induction. BN1, BN2 and BAZ samples expressed MAP2 compared with uninfected controls. TRPA1, TRPM8, TRPV1 and NaV1.7 were present only in BN1 and BN2. GAPDH amplification in samples provided the loading control, and GAPDH used in the reverse transcriptase–negative (−RT) control for contaminating genomic DNA. Full-length images are shown in Supplementary Figure 12. (b) Representative calcium responses for 10 μM capsaicin (Cap), 100 μM menthol (Menth), and 100 μM mustard oil (MO). Calcium transients were measured using Map2::GCAMP5.G. Calcium responses were calculated as the change in fluorescence (ΔF) over the initial fluorescence (Fo). Depolarization with 25 mM KCl was used at the beginning and end of each experiment to confirm neural identity and sustained functional capacity. (c) Screenshot images of GCAMP fluorescence in BN2 iSNs in response to the addition of buffer, 10 μM capsaicin (cap) and 25 mM KCl. Scale bars represent 25 μm. (d,e) ΔF/F0 intensity plot showing the response of individual cells to each ligand. Each cell is represented in each column. Cells respond to KCl only (black circle), KCl plus one other ligand (colored circle) or KCl plus two other ligands (triangle or square). (f) Distribution of ligand response in BN1 (n = 146) and BN2 (n = 138). Populations of iSNs responded to Cap (BN1, 4.4 ± 1.7%; BN2, 5.9 ± 3.3%), Menth (BN1, 4.4 ± 1.4%; BN2, 6.0 ± 2.3%) and MO (BN1, 12.8 ± 4.5%; BN2, 8.8 ± 3.7%), with small subpopulations responding to two ligands sequentially. iSNs responded to two ligands sequentially: Cap and MO (BN1, 3.2 ± 0.7%; BN2, 1.2 ± 1.2%), Menth and MO (BN1, 1.9 ± 1.9%; BN2, 1.1 ± 1.1%). The majority of KCl responsive iSNs did not respond to any of the three ligands (BN1, 83.1 ± 4.9%; BN2, 82.6 ± 3.4%). Bars represent means and error bars represent s.e.m. from seven independent experiments. (g) Representative calcium responses for 100 μM histamine (Hist), 100 μM chloroquine (CQ), 10 μM BAM8-22 (B8-22), 10 μM SLI-GRL (SLI). (h) ΔF/F0 intensity plots of three separate ligand combination regimes showing the response of individual cells to each ligand. Each cell is represented in each column. Cells responded to KCl only (black circle), KCl plus one other ligand (colored circle) or KCl plus two other ligands (triangle or square). (i) Distribution of ligand response in BN1 and BN2 to Hist (BN1, 4.8 ± 1.4%; BN2, 2.6 ± 1.6%), CQ (BN1, 0.8 ± 0.4%; BN2, 2.0 ± 1.6%), B8-22 (BN1, 1.8 ± 1.8%; BN2, 3.1 ± 1.1%), SLI (BN1, 1.5 ± 0.7%; BN2, 0.3 ± 0.3%), Hist and CQ (BN1, n = 288; BN2, n = 302), and B8-22 and SLI (BN1, n = 183; BN2, n = 234). Bars represent means and error bars represent s.e.m. from three independent experiments.

