Abstract
When applying histotripsy pulses shorter than 2 cycles, the formation of a dense bubble cloud only relies on the applied peak negative pressure (p-) exceeding the “intrinsic threshold” of the medium (absolute value of 26 – 30 MPa in most soft tissue). A previous study conducted by our research group showed that a sub-threshold high-frequency probe pulse (3 MHz) can be enabled by a sub-threshold low-frequency pump pulse (500 kHz) where the sum exceeds the intrinsic threshold, thus generating lesion-producing dense bubble clouds (“dual-beam histotripsy”). This paper investigates the feasibility of using an imaging transducer to provide the high-frequency probe pulse in the dual-beam histotripsy approach. More specifically, an ATL L7–4 imaging transducer, pulsed by a Verasonics V-1 Data Acquisition System, was used to generate the high-frequency probe pulses. The low-frequency pump pulses were generated by a 20-element 345 kHz array transducer, driven by a custom high voltage pulser. These dual-beam histotripsy pulses were applied to red-blood-cell (RBC) tissue-mimicking phantoms at a pulse repetition frequency of 1 Hz, and optical imaging was used to visualize bubble clouds and lesions generated in the RBC phantoms. The results showed that dense bubble clouds (and resulting lesions) were generated when the p- of the sub-threshold pump and probe pulses combined constructively to exceed the intrinsic threshold. The average size of the smallest reproducible lesions using the imaging probe pulse enabled by the sub-threshold pump pulse was 0.7 × 1.7 mm while that using the supra-threshold pump pulse alone was 1.4 × 3.7 mm. When the imaging transducer was steered laterally, bubble clouds and lesions were steered correspondingly until the combined p- no longer exceeded the intrinsic threshold. These results were also validated with ex vivo porcine liver experiments. Using an imaging transducer for dual-beam histotripsy can have two advantages, 1) lesion steering can be achieved using the steering of the imaging transducer (implemented with the beamformer of the accompanying programmable ultrasound system) and 2) treatment can be simultaneously monitored when the imaging transducer is used in conjunction with an ultrasound imaging system.
Keywords: Dual-Beam Histotripsy, Pump-Probe, Histotripsy Tissue Fractionation
INTRODUCTION
High-amplitude ultrasound wave has been shown to be capable of producing + soft tissue destruction (Barnard et al. 1955; Fry and Dunn 1956; Fry et al. 1970; Dunn and Fry 1971; Tavakkoli et al. 1997; Cathignol et al. 1998). Histotripsy uses short (< 20 cycles), high-pressure (> 10 MPa) ultrasound pulses to generate contained dense bubble clouds and produce well-demarcated tissue fractionation (Roberts 2005; Parsons et al. 2006a; Lake et al. 2008; Vlaisavljevich et al. 2013). When these energetic bubble clouds are targeted at a fluid-tissue interface, controlled tissue erosion can also be created. (Xu et al. 2004; Xu et al. 2010; Owens et al. 2011; Miller et al. 2013). Additionally, histotripsy can induce controlled comminution of model renal calculi at a fluid-calculus interface (Duryea et al. 2011a; Duryea et al. 2011b).
A study by Maxwell et al. (Maxwell et al. 2013) demonstrated that when histotripsy was applied with pulses shorter than two cycles, the formation of a dense bubble cloud only depended on the applied peak negative pressure (p-) exceeding the “intrinsic threshold” of the medium (absolute value of 26 – 30 MPa in most soft tissues with a high water content). With an applied p- not significantly higher than this threshold, a very precise, sub-wavelength lesion could be consistently generated (“microtripsy”) (Lin et al. 2014b).
Our recent study (Lin et al. 2014a) shows that a sub-threshold high-frequency probe pulse (3 MHz, < 2 cycles) can be enabled by a sub-threshold low-frequency pump pulse (500 kHz, < 2 cycles) to exceed the intrinsic threshold. This pump-probe method of controlling a supra-threshold volume is called “dual-beam histotripsy.” Since the low-frequency pulse experiences less attenuation/aberration, and the high-frequency pulse can provide precision in lesion formation, this dual-beam histotripsy approach can be very useful in situations where precise lesion formation is required through a highly attenuative/aberrative medium, especially if a small acoustic window is available for the high-frequency pulse (Lin et al. 2014a).
In this paper, we investigated the feasibility of using a diagnostic imaging transducer to provide the high-frequency probe pulse for dual-beam histotripsy. The diagnostic imaging transducer was driven by a Verasonics ultrasound system (Verasonics, Inc., Redmond, WA) to achieve high-amplitude pulsing, programmable beam steering, and proper synchronization with the low-frequency pump pulses. Using a diagnostic imaging transducer could provide not only the steering capability for the high-frequency pulse, thus making the resulting bubble clouds and lesions steerable, but also the image guidance and feedback during treatment if the imaging transducer is used in conjunction with an imaging system. This dual-beam histotripsy using a diagnostic imaging transducer can have a number of applications. For example, a transcostal application (through ribs) of a low-frequency pump pulse can enable an imaging transducer pulse, which is applied between ribs (intercostal), to perform noninvasive transcostal tissue ablation. A transperineal application of a low-frequency pump pulse can enable a transrectal imaging transducer pulse to perform prostatic tissue ablation. This approach can also be useful in transcranial therapies wherein a low-frequency pump pulse is applied transcranially in conjunction with an imaging transducer pulse that is applied through a small surgically-removed skull opening (considered as invasive in this case).
Conventionally, the transmission pulse amplitude of a diagnostic ultrasound transducer does not exceed defined limits to avoid inducing possible harmful bioeffects. Thermal index (TI) and mechanical index (MI) are the two primary metrics that the Food and Drug Administration (FDA) uses to regulate the acoustic output of a diagnostic ultrasound system. However, for therapeutic ultrasound systems, these restrictions no longer apply, and some studies have investigated using diagnostic ultrasound transducers to perform therapy procedures. Specifically, Bailey et al utilized acoustic radiation forces generated by a diagnostic transducer and a Verasonics system to displace kidney stones in order to expel small stones or relocate an obstructing stone to a nonobstructing location (Bailey et al. 2013; Harper et al. 2013; Sorensen et al. 2013).
METHODS
In this study, a 20-element 345 kHz array transducer was used to provide the low-frequency pump pulses, while an ATL L7-4 imaging transducer (Philips Healthcare, Andover, MA) pulsed by a Verasonics ultrasound system was used to generate the high-frequency probe pulses. The feasibility of this dual-beam histotripsy approach using an imaging transducer was tested with red-blood-cell (RBC) tissue mimicking phantoms and validated in ex vivo porcine liver tissue. The capability of steering bubble clouds and lesions by steering the imaging transducer was also investigated. In the ex vivo porcine liver experiments, the L7–4 imaging transducer together with the Verasonics system was used to provide image feedback for treatment monitoring in addition to forming lesion-producing bubble clouds.
Sample Preparation
The procedures described in this study were approved by the University of Michigan’s Committee on Use and Care of Animals.
The red-blood-cell (RBC) tissue-mimicking phantoms can be used to investigate cavitation-induced damage optically, and they were prepared following the protocol of previous studies (Maxwell et al. 2010; Lin et al. 2014b). In this study, fresh canine blood was obtained from adult research canine subjects in an unrelated study, stored at 4°C with an anticoagulant solution, citrate-phosphate-dextrose (CPD) (C7165, Sigma-Aldrich, St. Louis, MO), and used within 3 weeks. A low-melting-point agarose powder (AG-SP, LabScientific, Livingston, NJ) was used for making the agarose hydrogel in RBC phantoms.
Experiments were also performed in porcine livers to validate the results observed in the RBC phantoms. Fresh porcine livers were collected from porcine subjects in another unrelated study, kept in 0.9% saline at 4°C, and used within 36 hours. The porcine hepatic specimens were embedded in agarose hydrogel using the same protocol described in the previous study (Lin et al. 2014a).
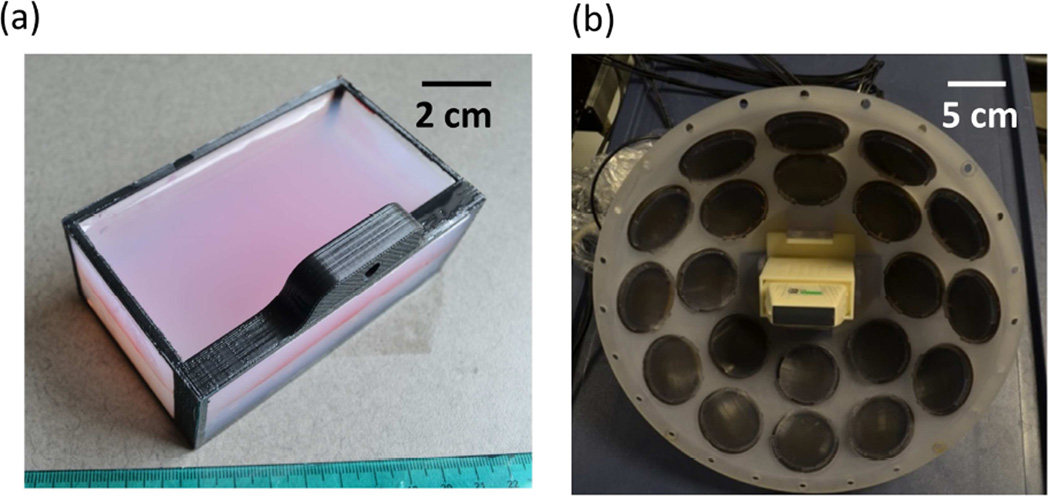
Both the RBC phantoms and hydrogel-embedded hepatic specimens were prepared in custom rectangular gel holders [40 × 105 × 62.5 mm, Fig. 1(a)] consisting of an acrylonitrile butadiene styrene (ABS) plastic supporting frame and thin polycarbonate membranes (254 µm thick) glued on four sides. A 50-µm-thick clear DuraLar polyester film (McMaster-Carr, Aurora, OH) was attached to another side (facing transducers in the experiments) for holding liquid agarose gel during the gel preparation process, and was later removed for experiments.
Fig. 1.
(a) A picture of the red-blood-cell tissue-mimicking phantom in the custom gel holder. (b) A picture of the 345 kHz array transducer with the ATL L7–4 imaging transducer inserted into its center hole.
Histotripsy Pulse Generation and Calibration
Low-frequency pump pulses were generated by a custom, 20-element 345 kHz array transducer [Fig. 1(b)]. Each element consisted of two 690 kHz, 50-mm-diameter piezoceramic discs (SM111, Steiner and Martins, Miami, FL) stacked together with epoxy. Each element was assembled in a plastic housing with a stereo-lithography-printed acoustic focusing lens of a geometric focal length of 150 mm (material: Accura® 60, 3D Systems, Rock Hill, SC) and backed with slow-curing marine epoxy (A-side Resin 314 + B-side Slow Hardener 143, TAP Plastics, Inc., San Leandro, CA). These elements were confocally aligned and arranged into two rings: 1) 1st ring – eight elements with a 38-degree tilt angle, and 2) 2nd ring – twelve elements with a 62-degree tilt angle. The corresponding effective f-number of the 345 kHz array transducer was 0.55, derived using the ratio of the focal length to the distance between the outer edges of the two opposing elements in the 2nd ring of the array transducer. A custom 20-channel high voltage pulser was used to drive the array transducer, allowing individual elements to output pulses shorter than 2 cycles. This pulser was connected to a field-programmable gated array (FPGA) development board (Altera DE1, Terasic Technology, Dover, DE) specifically programmed for dual-beam histotripsy pulsing.
High-frequency probe pulses were generated by a commercial linear imaging transducer, ATL L7–4 (Philips Healthcare, Andover, MA). This ATL L7-4 imaging transducer has 128 elements, a nominal bandwidth of 4.0 – 7.0 MHz, and a field of view of 38 mm. The imaging transducer was mounted in the center hole of the 345 kHz array transducer with a custom stereolithography-printed ABS-plastic adapter wherein the surface of the imaging transducer was 31 mm away from the focus of the 345 kHz array transducer. A Verasonics V-1 Data Acquisition System (Versonics, Redmond, WA) was used to pulse the imaging transducer at 5 MHz, and the imaging transducer was set to focus at a depth of 31 mm using conventional B-mode beamforming with all 128 elements transmitting (effective f-number in lateral direction = 0.82). The Verasonics system received trigger signals from the FPGA board to maintain synchronization of 345 kHz pump and imaging probe pulses.
A fiber-optic probe hydrophone (FOPH) adapted from a previously published design (Parsons et al. 2006b) was used to measure the acoustic output pressure of the 345 kHz array transducer and the L7–4 imaging transducer. The model and manufacturer for the components in the custom FOPH are PDB410A-AC and Thorlabs (Newton, NJ) for the photo detector, LDI-805 and Laser Drive Inc. (Gibsonia, PA) for the laser diode driver, and 15-22500-50-66640 and Gould Fiber Optics (Millersville, MD) for the fiber optic coupler.
Experiments in RBC Phantoms and Lesion Analysis
The experimental setup for the treatment in RBC phantoms is illustrated in Fig. 2. The 345 kHz array transducer was submerged in a glass tank filled with degassed water, while the ATL L7-4 imaging transducer was inserted into its center hole. The RBC phantoms were mounted on a 3-axis motorized positioner (Velmex, Bloomfield, NY) and submerged in the water tank with an orientation for the visualization of axial-lateral-plane lesions.
Fig. 2.
An illustration of the overall experimental setup in RBC phantom experiments. The 20-element 345 kHz array transducer is supported by optical posts and submerged in a glass tank filled with degassed water. A custom 20-channel high-voltage pulser was used to drive the 345 kHz array transducer. The ATL L7–4 imaging transducer was inserted to the center hole of the 345 kHz array transducer and pulsed by a Verasonics V-1 data acquisition system. An RBC phantom in a gel holder is mounted on a 3-axis motorized positioner and positioned at the focus of the transducer. A digital CMOS camera (Phantom V210), along with a Tominon lens and optical bellows, is used to visualize the bubble clouds and lesions generated in the RBC phantoms. A continuous wave white light source is used for back-lit illumination. An FPGA development board maintains the transducer firing and image capturing in synchronization.
A digital, 1-megapixel, CMOS, mono-color camera (Phantom V210, Vision Research, Inc., Wayne, NJ) was used to visualize the cavitational bubble clouds and their resulting damages in RBC phantoms. With an additional magnifying lens (Tominon, 1:4.5, f = 135 mm) and optical bellows, the resolution of these captured images was approximately 13 µm per pixel. A continuous-wave (CW) white light source was used to provide back-lit illumination for high speed photography. The FPGA board provided trigger signals to the camera to maintain the synchronization of image capturing and the delivery of histotripsy pulses. For every delivered histotripsy pulse, two images were acquired, one (bubble cloud image) at 40 µs after the arrival of the pulse when the maximal spatial extent of the bubble cloud was observed, and the other (lesion image) at 500 ms after the arrival of the pulse, where only histotripsy-induced damage in the RBC phantom was observed. The exposure time was 2 µs for every captured image. These optical images were then post-processed with MATLAB (R2011a, MathWorks, Natick, MA) using a method similar to those described in previous papers (Maxwell et al. 2010; Wang et al. 2012; Lin et al. 2014a; Lin et al. 2014b).
Each intended treatment region in the RBC phantoms was exposed to 200 histotripsy pulses at a pulse repetition frequency (PRF) of 1 Hz. The reason behind choosing this PRF is to avoid the cavitation memory effect describe in a previous study (Wang et al. 2012). Single-focal-point exposures were performed in each case and the applied pressure level is listed in Table 1. Two experimental sets were performed in this study in order to achieve the following two goals. 1) To investigate the feasibility of this dual-beam histotripsy using the imaging transducer by comparing the lesions generated using three types of pulses: a sub-threshold low-frequency pump pulse (Case #1), a sub-threshold pump pulse enabling a sub-threshold imaging transducer pulse to exceed the intrinsic threshold (Case #2), and a supra-threshold low-frequency pump pulse (Case #3). 2) To study lesion steering by laterally steering the pump-pulse-enabled imaging pulse using the Verasonics System.
Table 1.
Peak negative pressures used in RBC phantom experiments.
| 345 kHZ |
5 MHz |
||||||
|---|---|---|---|---|---|---|---|
| Experimental Set |
Case | Focal p- in Free- Field (MPa)* |
Focal p- with Attenuation Correction (MPa)† |
Proportion§ (%) |
Focal p- in Free- Field (MPa) |
Focal p- with Attenuation Correction (MPa) ‡ |
Proportion§ (%) |
| #1 | #1 | 24.7 | 22.5 | 100 | 0 | 0 | 0 |
| #2 | 24.7 | 22.5 | 76 | 8.0 | 7.0 | 24 | |
| #3 | 30.4 | 27.7 | 100 | 0 | 0 | 0 | |
| #2 | All cases |
24.7 | 22.5 | 76 | 8.0 | 7.0 | 24 |
The p- values were linearly interpolated using the linear summed p- values shown in Fig. 4(d).
The p- values for 345 kHz pulses were linearly corrected by the attenuation contributed by the plastic gel holder (using FOPH measurement) and agarose hydrogel (using previously reported attenuation coefficients (Maxwell et al. 2010)).
The p- values for 5 MHz pulses were linearly corrected by the attenuation contributed by agarose hydrogel (using previously reported attenuation coefficients (Maxwell et al. 2010)).
The “proportion” is the ratio of the p- from individual frequency component to the total combined p-.
Validation in Ex Vivo Porcine Livers
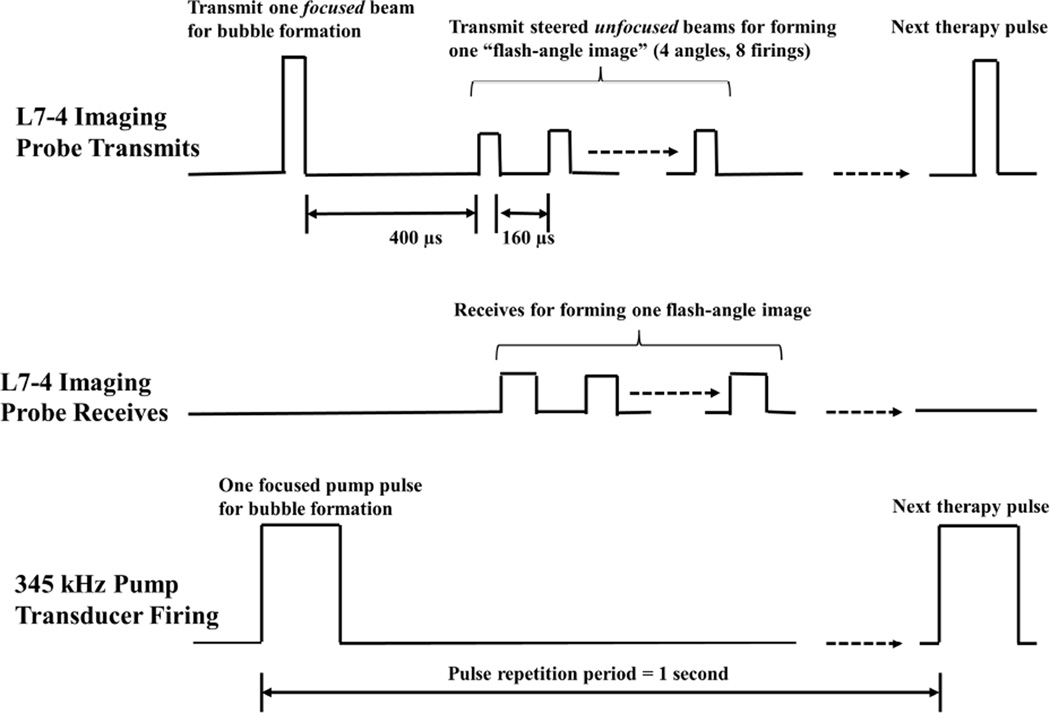
The experimental setup for ex vivo experiments with porcine hepatic specimens is similar to Fig. 2. However, due to tissue specimens not being optically transparent, ultrasound imaging was used instead of optical imaging for treatment monitoring. This ultrasound imaging is provided by the L7–4 imaging transducer and Verasonics, and the firing of the L7–4 imaging transducer is illustrated in Fig. 3. As can be seen, after receiving an external trigger signal, the L7–4 imaging transducer firstly transmitted a focused beam that produced bubble cloud together with the 345 kHz pump pulse, and then transmitted a series of steered unfocused beams to form a flash-angle imaging (flash imaging with multiple angles). In order to exclude the acoustic interference from the bubble-forming therapy pulse, the first transmitted wave of the flash-angle imaging was delayed 400 µs after the therapy pulse. Additionally, the driving voltage for these imaging pulses was decreased through lowering the amplitude of the apodization function so that its effect on the remnant nuclei could be minimized. Based on the free-field calibration with a needle hydrophone (HNR-0500, ONDA Corp., Sunnyvale, CA), these transmitted imaging pulses have a pressure level lower than 150 kPa (p-).
Fig. 3.
A schematic that shows the transmitted and received pulses of the L7-4 imaging transducer (controlled by Verasonics) in ex vivo porcine liver experiments. The L7-4 firstly transmits a “focused” beam (driven at 50 V by Verasonics) to produce bubble cloud together with a pump pulse provided by the 345 kHz array transducer. 400 µs later, the L7–4 transmits 8 steered “unfocused” beams for forming one flash-angle imaging with 160 µs separation between each tranmits. The effective driving voltage to the 8 steered unfocused beams is decreased by chaning the amplitude of the apodization function in the Verasonics. The L7–4 also receives the backscattered signals from these 8 steered unfocused beams for image reconstruction.
Each intended treatment region in the porcine hepatic specimens was exposed to 500 dual-beam histotripsy pulses at a PRF of 1 Hz. Single-focal-point exposures were performed in each case and the applied pressure levels are listed in Table 2. After treatment, the produced lesions were evaluated with both ultrasound B-mode imaging and histological sections using the same protocols described in the previous study (Lin et al. 2014a; Lin et al. 2014b). A high-frequency ultrasound probe, RMV 707B (15 – 45 MHz, VisualSonics, Toronto, ON, Canada), along with a high-frequency ultrasound scanner, Vevo 770 (VisualSonics), was used to provide off-line B-mode imaging for ultrasound evaluation of induced histotripsy lesions. For histological evaluation, H&E-stained 4-µm-thick histological sections with 100 µm sectioning step size were inspected under bright-field microscopy.
Table 2.
Peak negative pressures used in porcine liver experiments.
| 345 kHZ |
5 MHz |
||||||
|---|---|---|---|---|---|---|---|
| Experimental Set |
Case | Focal p- in Free- Field (MPa)* |
Focal p- with Attenuation Correction (MPa)† |
Proportion§ (%) |
Focal p- in Free- Field (MPa) |
Focal p-with Attenuation Correction (MPa) ‡ |
Proportion§ (%) |
| #3 | #1 | 25.9 | 23.6 | 77 | 8.0 | 7.1 | 23 |
| #2 | 26.5 | 24.4 | 78 | 8.0 | 7.0 | 22 | |
The p- values were linearly interpolated using the linear summed p- values shown in Fig. 4(d).
The p- values for 345 kHz pulses were linearly corrected by the attenuation contributed by the plastic gel holder (using FOPH measurement), and agarose hydrogel and porcine liver (using previously reported attenuation coefficients (Goss et al. 1978; Maxwell et al. 2010)).
The p- values for 5 MHz pulses were linearly corrected by the attenuation contributed by agarose hydrogel and porcine liver (using previously reported attenuation coefficients (Goss et al. 1978; Maxwell et al. 2010) ).
The “proportion” is the ratio of the p- from individual frequency component to the total combined p-.
RESULTS
Calibration Results
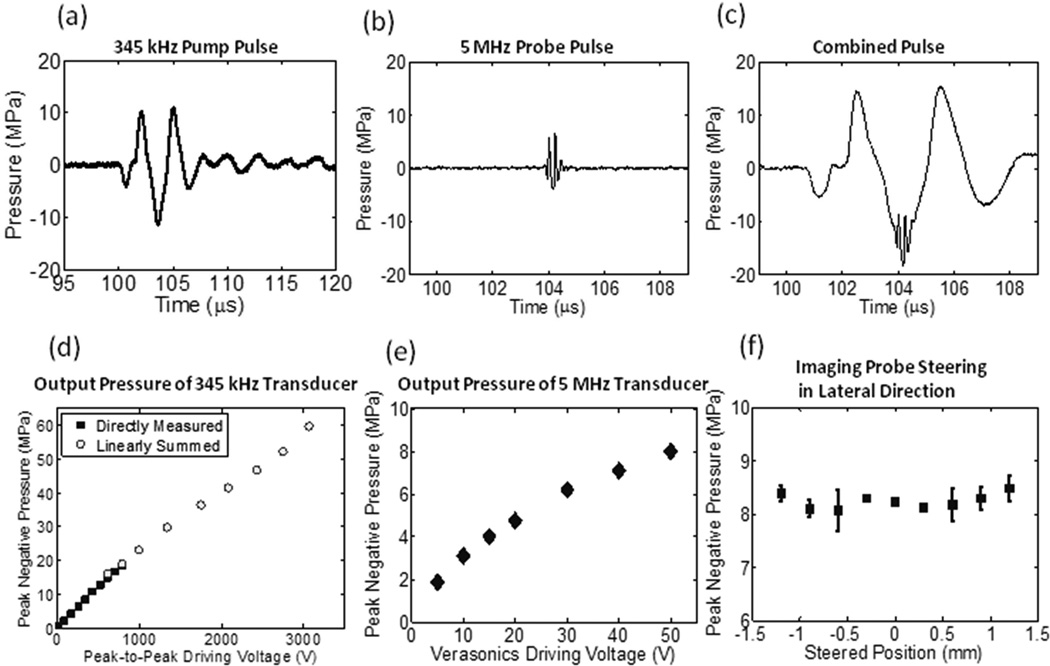
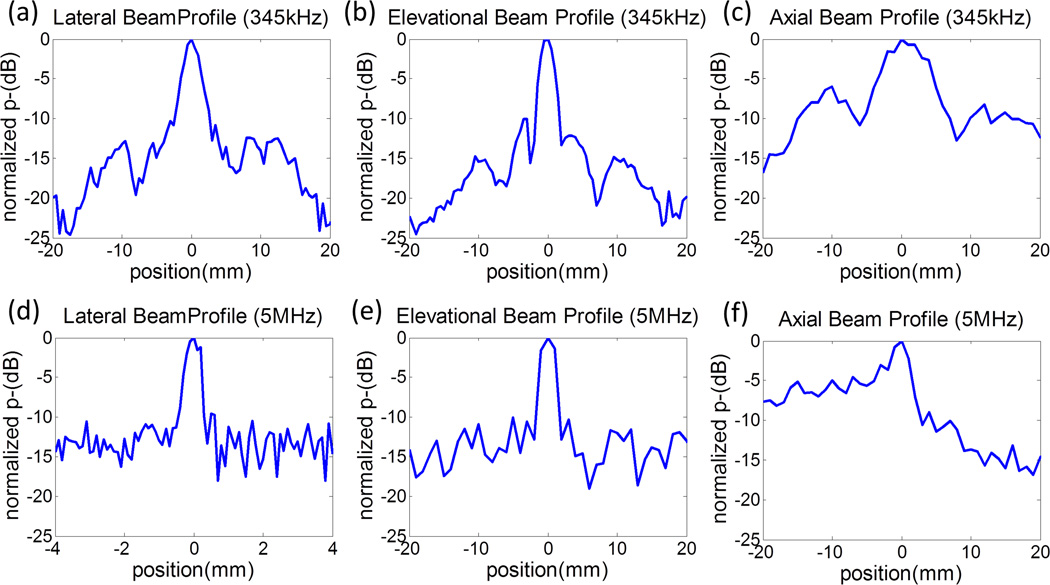
The calibration results are shown in Figs. 4 and 5, including representative focal pressure waveforms [Figs. 4(a) – (c)], output pressures as a function of driving voltage [Figs. 4(d) – (e)], output pressures of the L7–4 at various lateral steered locations [Fig. 4(f)], and one-dimensional (1D) beam profiles for the 345 kHz array transducer [Figs. 5(a) – 5(c)] and L7–4 [Figs. 5(d) – 5(f)].
Fig. 4.
Calibration results. (a) Representative focal acoustic waveforms in the free-field for the 345 kHz array transducer, (b) the L7–4 imaging transducer, and (c) the combination of the two, which was directly measured when both pulses were firing. Note that the time window in (a) is much wider than (b) and (c), for the purpose of showing the full-extent of the acoustic waveform of the 345 kHz array transducer. (d) p- as a function of the peak-to-peak driving voltage (to one representative element) for 345 kHz array transducer. Solid squares (▪) represent the results from direct measurements with all 20 elements firing simultaneously, while empty circles (○) represent the results from the summations of the individual elements when they were fired separately. (e) Focal p- as a function of the driving voltage (from Verasonics) for the L7–4 imaging pulse. (f) p- at the steered location when the L7–4 imaging transducer is steered laterally (N = 2, at a driving voltage of 50 V).
Fig. 5.
One-dimensional (1D) beam-profiles for the 345 kHz array transducer at a focal p- of 11 MPa [(a) -(c)] and the ATL L7–4 imaging transducer (5 MHz) when it is focused at 31 mm and with a focal p- of 8 MPa [(d) - (e)]. In all sub-figures, 0 mm indicates the focal location and, in the axial beam profiles, positions with a negative value indicate the prefocal region. Note that the lateral beam profile for 5 MHz (d) has a smaller scanning range (i.e. position from −4 to 4 mm) since it has a much smaller beam-width than others.
The measured –6 dB beamwidths for the L7–4 imaging transducer (focused at 31 mm and driven at 50 V) were 0.4 (lateral), 2.2 (elevational), and 3.5 mm (axial). The 345 kHz array transducer has a complex beam profile due to its construction and numerous active acoustic effects. Its −6 dB beamwidths (calculated based on p-) were measured to be 2.9 (lateral), 3.1 (elevational) and 10.0 mm (axial). Additionally, for the 345 kHz array transducer, all the side lobes are below 10–15 dB in the lateral and elevational directions and below 6 dB in the axial direction. For the imaging pulse, all the side lobes are below 10–15 dB in the lateral and elevational directions, and below 15 dB in the axial post-focal region and is around 5–10 dB in the pre-focal region. These side lobe levels would be unacceptably large for imaging purposes, but are quite sufficient for histotripsy therapy since histotripsy bubble clouds generated using the intrinsic threshold mechanism have a very sharp cavitation threshold (Maxwell et al. 2013; Lin et al. 2014b).
The influence of gel holders on focal acoustic pressures and beam profiles were also investigated. Based on the calibration with a representative gel holder in place, the p- for the 345 kHz array transducer was attenuated by 8.8%; however, the 1D beam-profiles did not change significantly. The transmitted acoustic waves of the imaging transducer were not expected to be attenuated by the gel holders since 1) the side of the gel holders facing the imaging transducer had a window much wider than the imaging transducer, and 2) the thin polyester film attached to that window was removed before experiments.
Feasibility of Dual-Beam Histotripsy using an Imaging Transducer in RBC Phantoms
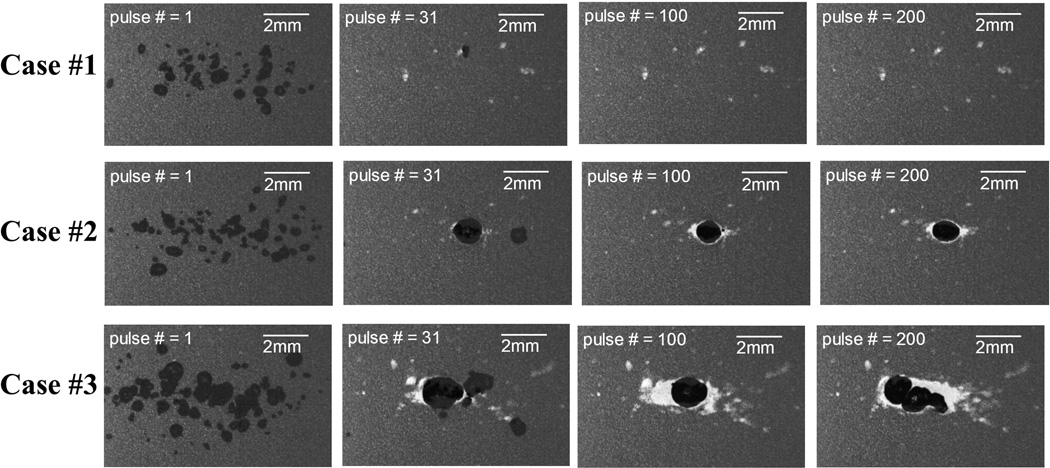
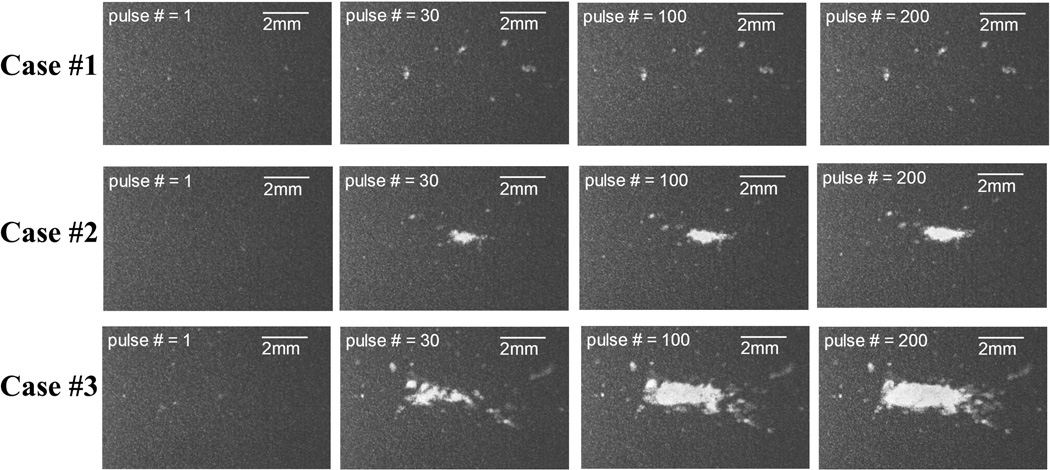
A total of 21 lesions were generated in RBC phantoms with three types of histotripsy pulses listed in Experimental Set #1 of Table 1 (seven lesions for each case). These three types included a sub-threshold 345 kHz pump pulse (Case #1), a sub-threshold 5 MHz probe pulse enabled by a sub-threshold 345 kHz pump pulse to exceed the intrinsic threshold (Case #2), and a supra-threshold 345 kHz pump pulse (Case #3).
Figs. 6 and 7 show representative bubble cloud and lesion imagines at various stages (pulse # = 1, 31, 100, and 200) of the treatment, respectively. As seen in the Fig. 6, all three cases had sparsely-distributed single cavitational bubbles generated at the first pulse (we called these “incidental bubbles” in the previous paper (Lin et al. 2014a)). At the 30th pulse, these incidental bubbles disappeared (see discussion in (Lin et al. 2014a)), and Cases #2 and #3 had consistent dense bubble clouds generated in the focal zone while no bubbles were generated in Case #1. Moreover, the sizes of the bubble clouds in Case #2 were significantly smaller than those in Case #3, and the locations where the bubble clouds generated were more confined in Case #2. At the end of the treatment, Cases #2 and #3 had a confined central lesion (called main lesion) induced by consistent bubble cloud generation along with some scattered peripheral damage induced by incidental bubbles generated at the beginning of the treatment. Case #1 only had scattered damage from incidental bubbles without a confined central lesion.
Fig. 6.
Representative bubble cloud images in the first set of the RBC phantom experiments. Dual-beam histotripsy pulses propagated from the left to the right of these images.
Fig. 7.
Representative lesion images in the first set of the RBC phantom experiments. Dual-beam histotripsy pulses propagated from the left to the right of these images.
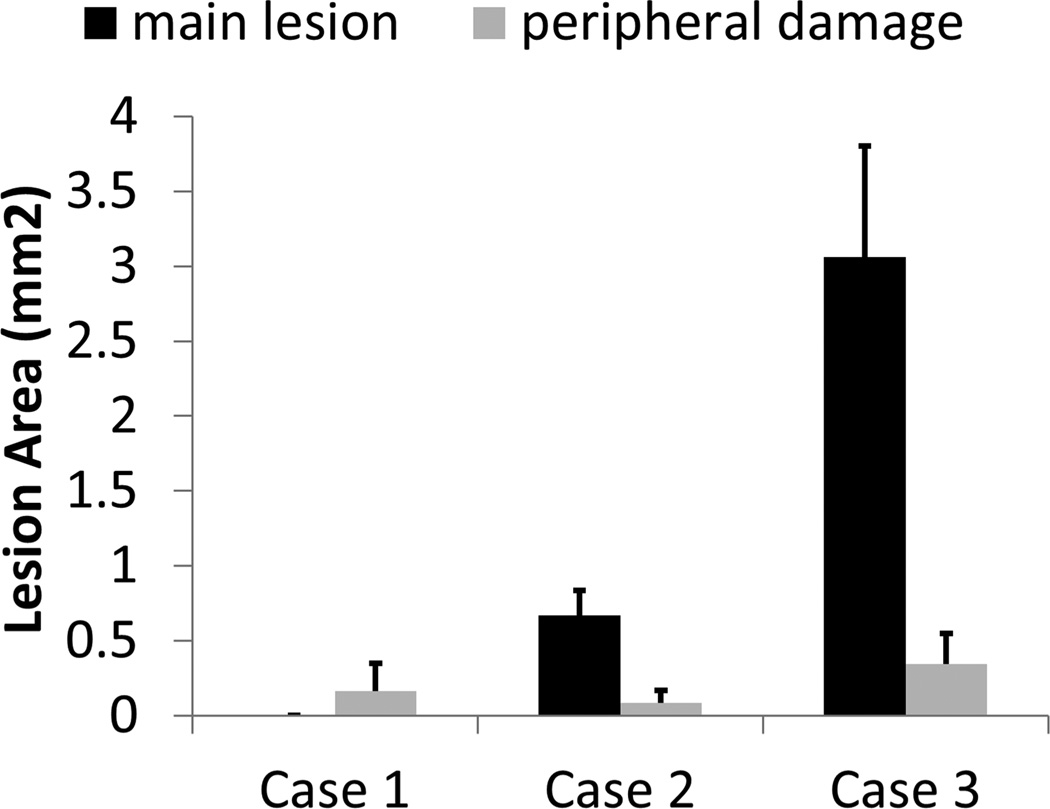
Fig. 8 summarizes the quantitative results from lesion analysis. As can be seen, when an imaging transducer pulse was applied together with a low-frequency pump pulse (Case #2), the area of the main lesion was significantly smaller than that for a supra-threshold low-frequency pump pulse alone (Case #3). The area of the main lesion produced by sub-threshold pulses (Case #1) was almost 0 (no central lesions were generated). The areas of the peripheral damage for all three cases were at similar levels, with Case #2 having the smallest average value. Additionally, the average widths of the main lesions are 0.0 (± 0.0, standard deviation), 0.7 (± 0.1), and 1.4 (± 0.2) mm for Case #1, #2, and #3, respectively. The average lengths of the main lesions are 0.0 (± 0.0), 1.7 (± 0.3), and 3.4 (± 0.4) mm for Case #1, #2, and #3, respectively.
Fig. 8.
Quantitative results for the first set of the RBC phantom experiments. Area of the main lesion is plotted in dark black, and area of the peripheral damage is plotted in light gray. The vertical bars in these figures represent + one standard deviation, and the sample size for each case is seven (N = 7).
Lesion Steering using the Imaging Transducer in RBC Phantoms
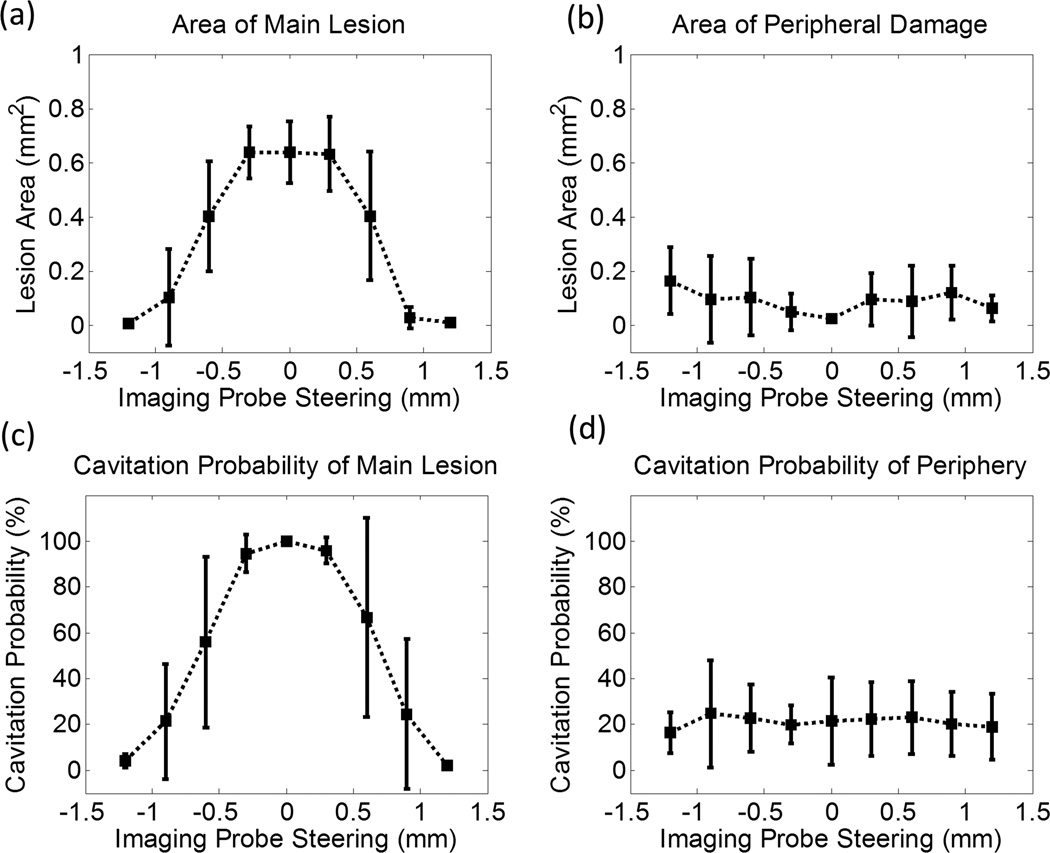
A total of 54 lesions were generated in RBC phantoms at nine imaging transducer steering distances (−1.2, −0.9, −0.6, −0.3, 0.0, 0.3, 0.6, 0.9, and 1.2 mm, six lesions for each case). Table 1 (Experimental Set #2) lists the applied pressures (p-) for the 345 kHz pump pulse and 5 MHz probe pulse. The applied focal p- (at 0.0 mm) of the 345 kHz pump pulse was kept the same for all cases and no steering was applied to the pump pulse. The driving voltage to the imaging transducer was also kept the same and the measurement in Fig. 4(f) showed that there was not significant change in p- when the imaging transducer was steered from −1.2 to 1.2 mm.
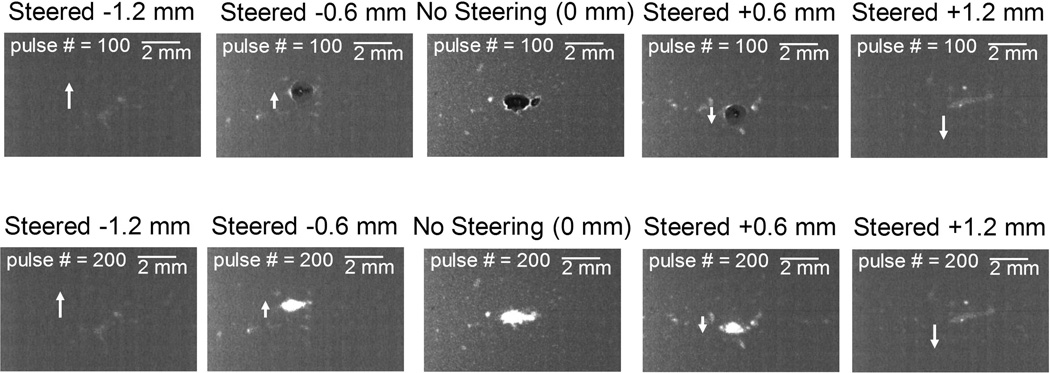
Fig. 9 shows representative bubble cloud and lesion images for these nine steering distances (to increase readability, only every other case is shown). As can be seen in the figure, when the imaging transducer was steered laterally, bubble clouds and lesions were also steered correspondingly. However, when the imaging transducer was steered farther than 0.6 mm, bubble clouds and lesions were no longer consistently generated, which could be an indication that the combined p- had decreased to below the intrinsic threshold. Since the p- for the imaging transducer remained at a similar level across different steering distances [shown in Fig. 4(f)], this decrease in combined p- was likely due to the p- for the 345 kHz pump pulse being lower at those locations [shown in Fig. 5(a)].
Fig 9.
Representative bubble cloud (upper row) and lesion (lower row) images in the second set of the RBC phantom experiments wherein the imaging transducer was steered laterally. Each column represents the images at each steering distances. Only every other case (−1.2, −0.6, 0, +0.6, and +1.2 mm) is shown in order to increase readability. White arrows indicate the steering direction of the imaging transducer and dual-beam histotripsy pulses propagate from the left to the right of these images.
The quantitative results after lesion analysis show that the area of the main lesion [Fig. 10(a)] is at its maximum without any steering. It gradually decreases when the imaging transducer is steered laterally, and it approaches 0 when the imaging transducer is steered to ±1.2 mm. On the other hand, the area of the peripheral damage [Fig. 10(b)] stays at a similar level across all steering distances, with 0 mm having the lowest average value. Additionally, the cavitation probability in the main lesion [Fig. 10(c)] starts at almost 100% without any steering, it gradually decreases when the imaging transducer is steered laterally, and it finally approaches 0% when the imaging transducer is steered to ±1.2 mm. The cavitation probability in the periphery [Fig. 10(d)] stays at a similar level across all steering distances. The cavitation probability here is defined as the percentage of observed cavitation events over the course of 200 delivered histotripsy pulses, and is obtained using captured optical bubble cloud images with the imaging processing method described in the previous study (Lin et al. 2014a).
Fig. 10.
Quantitative results for the second set of the RBC phantom experiments wherein the imaging transducer was steered laterally. (a) Area of the main lesion, (b) area of the peripheral damage, (c) cavitation probability in the main lesion, and (d) cavitation probability in the periphery as a function of the lateral steering distance of the imaging transducer. The vertical bars in these figures represent +/– one standard deviation, and the sample size for each case is six (N = 6).
Ex Vivo Porcine Liver Experiments
A total of four lesions were generated in two porcine hepatic specimens using dual-beam histotripsy pulses with the pressure levels shown in Table 2 (two lesions for each pressure level). Fig. 11(a) shows a representative flash angle image (using L7–4 + Verasonics) during the treatment wherein a cavitational bubble cloud (or the remnant nuclei) can be visualized. Fig. 11(b) shows a high resolution B-mode image (using RMV707B scanhead + Vevo 770) after the treatment wherein a formed lesion can be seen as a hypoechoic region. A representative H&E-stained histological section for each pressure level is displayed in Fig. 12. As can be seen, the treated regions have lost their normal architecture and contain only acellular debris. Quantified using the histological sections, the produced lesions’ average dimensions were 1.2 (lateral) × 2.5 (axial) mm for pressure level #1 and 1.4 (lateral) × 3.4 (axial) mm for pressure level #2.
Fig. 11.
Treatment monitoring and lesion evaluation using ultrasound imaging in ex vivo porcine liver experiments. Ultrasound propagated from the top to the bottom of these images. (a) For the treatment monitoring, flash-angle imaging provided by the L7–4 imaging transducer and the Verasonics system is performed between two therapy pulses. (b) After the treatment, lesions are evaluated using the VisualSonics Vevo 770 and the RMV707B scanhead.
Fig. 12.
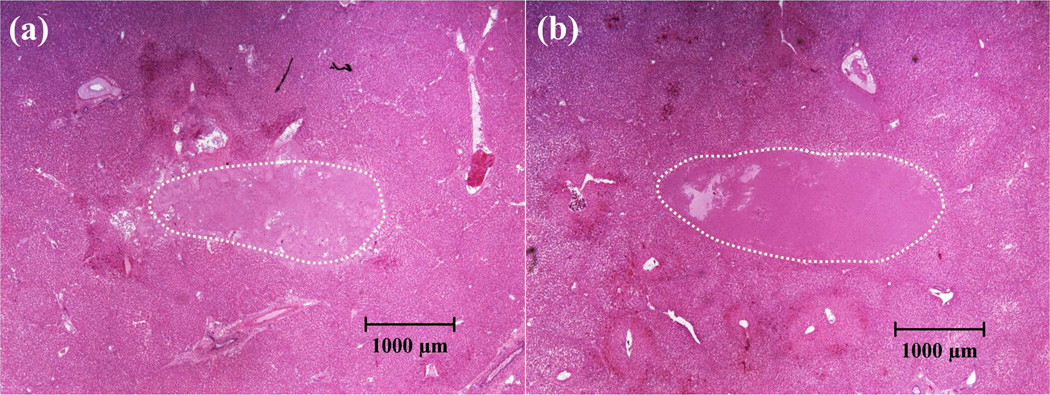
H&E-stained histological sections for porcine hepatic specimens after treatment (345 kHz pump pulse + 5 MHz probe pulse, ultrasound propagated from the left to the right of the image). (a) Lesion treated using pressure level #1 (case #1) of Table 2. (b) Lesion treated using pressure level #2 (case #2) of Table 2. These images were taken using bright field microscopy.
Discussion
This paper demonstrates that a sub-threshold high-frequency probe pulse provided by an imaging transducer can create lesion-producing bubble clouds when this probe pulse is “enabled” by a sub-threshold low-frequency pump pulse to exceed the intrinsic threshold (dual-beam histotripsy (Lin et al. 2014a) using an “imaging transducer”).
The results of the beam steering experiments showed that the bubble clouds and produced lesions could be steered by only steering the imaging transducer as long as the combined p-reached the intrinsic threshold (±0.6 mm steering capability in this current design). Since there were no significant changes in the output pressure of the imaging transducer when it was steered ±1.2 mm laterally [shown in Fig. 4(f)], the limitation in this steering range was solely contributed by the limited lateral beamwidth of the low-frequency pump transducer (i.e., its p- dropped considerably at 1.2 mm away from the focus, approximately 5–6 dB). This limitation can be improved by employing a pump transducer with a larger focal zone, which could be accomplished by a higher f-number design with lower frequency elements. On the other hand, if the pump transducer has sufficient steering capability, we can also steer the low-frequency pump pulse along with the imaging transducer probe pulse. The pump transducer in this study was not designed for a wide steering range. It can only steer approximately 10 mm in the lateral direction (the estimated focal p- drops to 24 MPa at full power and the side lobe is still 5 dB down) and less than 8 mm in the axial direction (the side lobe is reaching similar level of the main lobe). These steering limits were obtained through transient simulation using FOCUS software (Kelly and McGough 2006; Chen and McGough 2008; Kelly and McGough 2009).
As mentioned in the introduction, this dual-beam histotripsy using an imaging transducer can be useful in several situations, such as a transcostal application of pump pulses together with an intercostal application of imaging transducer pulses for transcostal tissue ablation, a transperineal application of pump pulses together with a transrectal application of imaging transducer pulses for prostatic tissue ablation, and a transcranial application of pump pulses together with an application of imaging transducer pulses through a small surgical opening for transcranial tissue ablation. The pump transducer in this paper is a research prototype. However, pump transducers can be designed to meet the requirements of specific clinical applications. For example, in transcranial application, the pump transducer would be a hemisphere that covers skull cap. In transcostal application, the design can be an aperture covering the whole chest with sufficient penetration depth. In trans-perineal application, the pump transducer would be limited in size by the restricted acoustic window of the perineum (pelvic bone obstruction).
Additionally, when applying this technique to in vivo situations, two issues have to be considered: 1) a long propagation depth would cause significant attenuation for the imaging transducer pulse even though it travels through a relatively low attenuation acoustic window and 2) the spatial and temporal alignment between the pump and probe pulses would need to be maintained.
The attenuation probably would not significantly affect the transrectal application of the imaging transducer pulses since the anatomical distance between prostate and a transrectal imaging transducer in humans can be minimal. On the other hand, the propagation depths in transcranial and transcostal applications can be substantial enough to cause significant attenuation. For example, in transcostal liver ablation, the propagation depth averaged 4–6 cm for porcine subjects in one of previous studies conducted by our research group (Vlaisavljevich et al. 2013), and this could lead to an attenuation of about 76% for a 5MHz imaging transducer pulse [assuming linear attenuation using 0.5 dB/(cm.MHz) attenuation coefficient]. The attenuation could be compensated by increasing the pressure output of the imaging transducer pulses by using an imaging system with a higher power drive option. Additionally, we can exchange precision in lesion formation for less attenuation by using a slightly lower-frequency imaging transducer. Another possible approach would be to use an endoscopic imaging probe for minimally invasive procedures.
For the alignment between pump and probe pulses, we can firstly perform the alignment in the free-field (water), and then apply corrections for in vivo situations. Using a large-focal-zone pump transducer would provide a larger target for imaging transducer alignment (spatially). Temporal corrections could be performed by surveying the thickness of the intervening tissue for the pump and imaging transducers separately and then computing the proper time delay between them. Finally, whether the combined pressure reaches the cavitation threshold can be determined using real-time B-mode imaging. The results in this study and the previous dual-beam histotripsy study (Lin et al. 2014a) suggest that unpredictable focal damage due to temporal or spatial misalignment between pump and probe pulses would be minimal since the intrinsic threshold would be obtained only through alignment.
The smallest reproducible lesion in this study (~ 0.7 × 1.7 mm in experimental set #1) is somewhat larger than the smallest ones shown in our previous dual-beam histotripsy study (Lin et al. 2014a) (~ 0.2 × 0.4 mm) where the probe pulse was 3 MHz. In the previous study, the probe pulse contributed ~ 60% of the combined p- whereas in this study the probe pulse only contributes about 25 % of the combined p-. Thus, a higher proportion of the high-frequency probe pulse could lead to smaller lesions, which was also demonstrated in (Lin et al. 2014a). Additionally, the focal size of the pump and probe transducers in this study are much wider than the ones in the previous study (Lin et al. 2014a), which could also increase the size of the smallest reproducible lesions. The –6 dB beamwidths of the transducers used in this study are 2.9 × 3.1 × 10.0 mm (345 kHz pump transducer) and 0.4 × 2.2 × 3.5 mm (5 MHz imaging transducer), while those in the previous study are 1.7 × 1.8 × 4.9 mm (500 kHz pump transducer) and 0.3 × 0.3 × 1.4 mm (3 MHz probe transducer).
Therefore, the current setup can be optimized in two ways in order to create a more precise (i.e. smaller) lesion: 1) increase the contribution of high-frequency probe pulse and 2) use another high-frequency probe pulse with a narrower beamwidth. More specifically, using an imaging system with a higher power drive option can increase driving voltage to the imaging transducer, thus raising its focal pressure output. To provide a probe pulse with narrower beamwidth, we could select an imaging transducer with either higher frequency or larger profile (leading to a lower f-number). However, some trade-offs need to be considered since choosing a higher frequency imaging transducer would limit the penetration depth.
Conclusion
An imaging transducer can create dense, lesion-producing bubble clouds when it is enhanced by a sub-threshold low-frequency pump pulse to exceed the intrinsic threshold (dual-beam histotripsy using an “imaging transducer”). Moreover, these lesion-producing bubble clouds could be steered by only steering the imaging transducer pulse, which could be realized using the beamformer of the ultrasound imaging system used to guide the therapy. When the imaging transducer is used in conjunction with an ultrasound system having imaging capability, image feedback for the treatment can be provided by the same imaging transducer.
This approach can potentially be very useful in producing precise lesions through a long propagation path or a highly aberrative medium, especially when a small low-attenuation acoustic window is available for the imaging transducer. For example, transcostal histotripsy liver tissue ablation can be performed together with an intercostal imaging pulse, which provides treatment precision (or selective ablation). The results from this study suggest that, with an imaging transducer providing only 20–25% of the combined pressure during dual-beam histotripsy, precise lesion formation can be controlled and steered by the imaging pulse. A wider-focal-zone pump transducer would cover a wider operation region for precise/selective tissue ablation.
Acknowledgements
The authors would like to thank Dr. Yohan Kim for the discussion about the fabrication and assembly of the 345 kHz array transducer. This work is supported by the National Institutes of Health (grants R01 CA134579, and R01 DK091267), National Institute of Biomedical Imaging and Bioengineering (NIBIB) of the National Institutes of Health under Award Number R01EB008998, The Hartwell Foundation, and a Research Scholar Grant from the American Cancer Society (RSG-13-101-01-CCE). Drs. Timothy L. Hall, Zhen Xu, and Charles A. Cain have financial interest and/or other relationship with HistoSonics.
Footnotes
Publisher's Disclaimer: This is a PDF file of an unedited manuscript that has been accepted for publication. As a service to our customers we are providing this early version of the manuscript. The manuscript will undergo copyediting, typesetting, and review of the resulting proof before it is published in its final citable form. Please note that during the production process errors may be discovered which could affect the content, and all legal disclaimers that apply to the journal pertain.
Reference List
- Bailey MR, Wang Y-N, Simon J, Cunitz B, Harper J, Hsi R, Starr F, Paun M, Dunmire B, Sapozhnikov O, Crum L, Sorensen M. Acoustic radiation force to reposition kidney stones. J Acoust Soc Am. 2013;133:3279. doi: 10.1121/1.4799599. [DOI] [PMC free article] [PubMed] [Google Scholar]
- Barnard JW, Fry WJ, Fry FJ, Krumins RF. Effects of high intensity ultrasound on the central nervous system of the cat. The Journal of Comparative Neurology. 1955;103:459–484. doi: 10.1002/cne.901030304. [DOI] [PubMed] [Google Scholar]
- Cathignol D, Tavakkoli J, Birer A, Arefiev A. Comparison between the effects of cavitation induced by two different pressure-time shock waveform pulses. Ultrasonics, Ferroelectrics, and Frequency Control, IEEE Transactions on. 1998;45:788–799. doi: 10.1109/58.677729. [DOI] [PubMed] [Google Scholar]
- Chen D, McGough RJ. A 2D fast near-field method for calculating near-field pressures generated by apodized rectangular pistons. J Acoust Soc Am. 2008;124:1526–1537. doi: 10.1121/1.2950081. [DOI] [PMC free article] [PubMed] [Google Scholar]
- Dunn F, Fry FJ. Ultrasonic Threshold Dosages for the Mammalian Central Nervous System. Biomedical Engineering, IEEE Transactions on. 1971:253–256. doi: 10.1109/tbme.1971.4502847. BME-18. [DOI] [PubMed] [Google Scholar]
- Duryea AP, Hall TL, Maxwell AD, Xu Z, Cain CA, Roberts WW. Histotripsy erosion of model urinary calculi. Journal of endourology / Endourological Society. 2011a;25:341–344. doi: 10.1089/end.2010.0407. [DOI] [PMC free article] [PubMed] [Google Scholar]
- Duryea AP, Maxwell AD, Roberts WW, Xu Z, Hall TL, Cain CA. In vitro comminution of model renal calculi using histotripsy. IEEE Trans Ultrason Ferroelectr Freq Control. 2011b;58:971–980. doi: 10.1109/TUFFC.2011.1898. [DOI] [PMC free article] [PubMed] [Google Scholar]
- Fry FJ, Kossoff G, Eggleton RC, Dunn F. Threshold Ultrasonic Dosages for Structural Changes n the Mammalian Brain. J Acoust Soc Am. 1970;48:1413–1417. doi: 10.1121/1.1912301. [DOI] [PubMed] [Google Scholar]
- Fry WJ, Dunn F. Ultrasonic Irradiation of the Central Nervous System at High Sound Levels. J Acoust Soc Am. 1956;28:129–131. [Google Scholar]
- Goss SA, Johnston RL, Dunn F. Comprehensive compilation of empirical ultrasonic properties of mammalian tissues. The Journal of the Acoustical Society of America. 1978;64:423–457. doi: 10.1121/1.382016. [DOI] [PubMed] [Google Scholar]
- Harper JD, Sorensen MD, Cunitz BW, Wang Y-N, Simon JC, Starr F, Paun M, Dunmire B, Liggitt HD, Evan AP, McAteer JA, Hsi RS, Bailey MR. Focused Ultrasound to Expel Calculi from the Kidney: Safety and Efficacy of a Clinical Prototype Device. The Journal of Urology. 2013;190:1090–1095. doi: 10.1016/j.juro.2013.03.120. [DOI] [PMC free article] [PubMed] [Google Scholar]
- Kelly JF, McGough RJ. A time-space decomposition method for calculating the nearfield pressure generated by a pulsed circular piston. Ultrasonics, Ferroelectrics and Frequency Control, IEEE Transactions on. 2006;53:1150–1159. doi: 10.1109/tuffc.2006.1642513. [DOI] [PMC free article] [PubMed] [Google Scholar]
- Kelly JF, McGough RJ. Transient Fields Generated by Spherical Shells in Viscous Media. AIP Conference Proceedings. 2009;1113:210–214. [Google Scholar]
- Lake AM, Hall TL, Kieran K, Fowlkes JB, Cain CA, Roberts WW. Histotripsy: Minimally Invasive Technology for Prostatic Tissue Ablation in an In Vivo Canine Model. Urology. 2008;72:682–686. doi: 10.1016/j.urology.2008.01.037. [DOI] [PMC free article] [PubMed] [Google Scholar]
- Lin K-W, Duryea AP, Kim Y, Hall TL, Xu Z, Cain CA. Dual-beam histotripsy: a low-frequency pump enabling a high-frequency probe for precise lesion formation. Ultrasonics, Ferroelectrics and Frequency Control, IEEE Transactions on. 2014a;61:325–340. doi: 10.1109/TUFFC.2014.6722617. [DOI] [PMC free article] [PubMed] [Google Scholar]
- Lin K-W, Kim Y, Maxwell AD, Wang T-Y, Hall TL, Xu Z, Fowlkes JB, Cain CA. Histotripsy beyond the intrinsic cavitation threshold using very short ultrasound pulses: microtripsy. Ultrasonics, Ferroelectrics and Frequency Control, IEEE Transactions on. 2014b;61:251–265. doi: 10.1109/TUFFC.2014.6722611. [DOI] [PMC free article] [PubMed] [Google Scholar]
- Maxwell AD, Cain CA, Hall TL, Fowlkes JB, Xu Z. Probability of Cavitation for Single Ultrasound Pulses Applied to Tissues and Tissue-Mimicking Materials. Ultrasound Med Biol. 2013;39:449–465. doi: 10.1016/j.ultrasmedbio.2012.09.004. [DOI] [PMC free article] [PubMed] [Google Scholar]
- Maxwell AD, Wang T-Y, Yuan L, Duryea AP, Xu Z, Cain CA. A Tissue Phantom for Visualization and Measurement of Ultrasound-Induced Cavitation Damage. Ultrasound in Medicine & Biology. 2010;36:2132–2143. doi: 10.1016/j.ultrasmedbio.2010.08.023. [DOI] [PMC free article] [PubMed] [Google Scholar]
- Miller RM, Kim Y, Lin K-W, Cain CA, Owens GE, Xu Z. Histotripsy Cardiac Therapy System Integrated with Real-Time Motion Correction. Ultrasound in Medicine & Biology. 2013;39:2362–2373. doi: 10.1016/j.ultrasmedbio.2013.08.004. [DOI] [PMC free article] [PubMed] [Google Scholar]
- Owens GE, Miller RM, Ensing G, Ives K, Gordon D, Ludomirsky A, Xu Z. Therapeutic ultrasound to noninvasively create intracardiac communications in an intact animal model. Catheterization and Cardiovascular Interventions. 2011;77:580–588. doi: 10.1002/ccd.22787. [DOI] [PMC free article] [PubMed] [Google Scholar]
- Parsons JE, Cain CA, Abrams GD, Fowlkes JB. Pulsed cavitational ultrasound therapy for controlled tissue homogenization. Ultrasound Med Biol. 2006a;32:115–129. doi: 10.1016/j.ultrasmedbio.2005.09.005. [DOI] [PubMed] [Google Scholar]
- Parsons JE, Cain CA, Fowlkes JB. Cost-effective assembly of a basic fiber-optic hydrophone for measurement of high-amplitude therapeutic ultrasound fields. J Acoust Soc Am. 2006b;119:1432–1440. doi: 10.1121/1.2166708. [DOI] [PubMed] [Google Scholar]
- Roberts WW. Focused ultrasound ablation of renal and prostate cancer: current technology and future directions. Urologic oncology. 2005;23:367–371. doi: 10.1016/j.urolonc.2005.05.022. [DOI] [PubMed] [Google Scholar]
- Sorensen MD, Bailey MR, Hsi RS, Cunitz BW, Simon JC, Wang YN, Dunmire BL, Paun M, Starr F, Lu W, Evan AP, Harper JD. Focused ultrasonic propulsion of kidney stones: review and update of preclinical technology. Journal of endourology / Endourological Society. 2013;27:1183–1186. doi: 10.1089/end.2013.0315. [DOI] [PMC free article] [PubMed] [Google Scholar]
- Tavakkoli J, Birer A, Arefiev A, Prat F, Chapelon J-Y, Cathignol D. A piezocomposite shock wave generator with electronic focusing capability: Application for producing cavitation-induced lesions in rabbit liver. Ultrasound in Medicine & Biology. 1997;23:107–115. doi: 10.1016/s0301-5629(96)00175-5. [DOI] [PubMed] [Google Scholar]
- Vlaisavljevich E, Kim Y, Allen S, Owens G, Pelletier S, Cain C, Ives K, Xu Z. Image-Guided Non-Invasive Ultrasound Liver Ablation Using Histotripsy: Feasibility Study in an In Vivo Porcine Model. Ultrasound in Medicine & Biology. 2013;39:1398–1409. doi: 10.1016/j.ultrasmedbio.2013.02.005. [DOI] [PMC free article] [PubMed] [Google Scholar]
- Wang T-Y, Xu Z, Hall TL, Fowlkes JB, Cain CA. An Efficient Treatment Strategy for Histotripsy by Removing Cavitation Memory. Ultrasound in Medicine & Biology. 2012;38:753–766. doi: 10.1016/j.ultrasmedbio.2012.01.013. [DOI] [PMC free article] [PubMed] [Google Scholar]
- Xu Z, Ludomirsky A, Eun LY, Hall TL, Tran BC, Fowlkes JB, Cain CA. Controlled ultrasound tissue erosion. IEEE Trans Ultrason Ferroelectr Freq Control. 2004;51:726–736. doi: 10.1109/tuffc.2004.1308731. [DOI] [PMC free article] [PubMed] [Google Scholar]
- Xu Z, Owens G, Gordon D, Cain C, Ludomirsky A. Noninvasive creation of an atrial septal defect by histotripsy in a canine model. Circulation. 2010;121:742–79. doi: 10.1161/CIRCULATIONAHA.109.889071. [DOI] [PMC free article] [PubMed] [Google Scholar]


