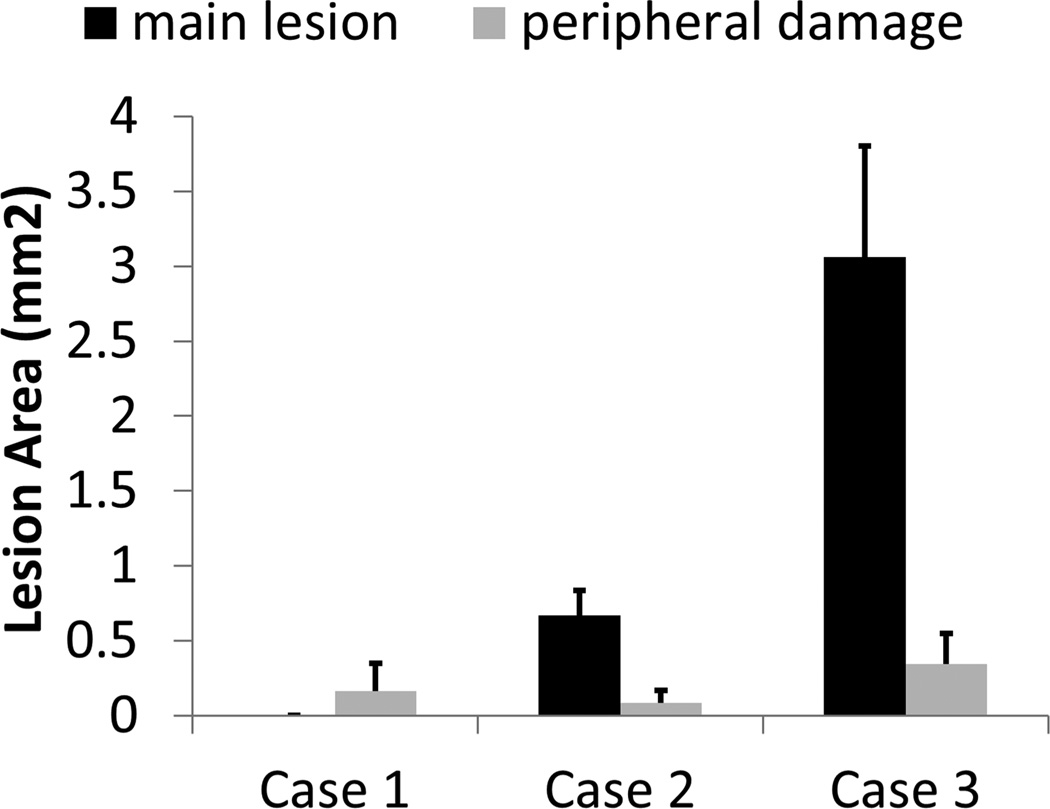
Fig. 8.
Quantitative results for the first set of the RBC phantom experiments. Area of the main lesion is plotted in dark black, and area of the peripheral damage is plotted in light gray. The vertical bars in these figures represent + one standard deviation, and the sample size for each case is seven (N = 7).

