Figure 2.

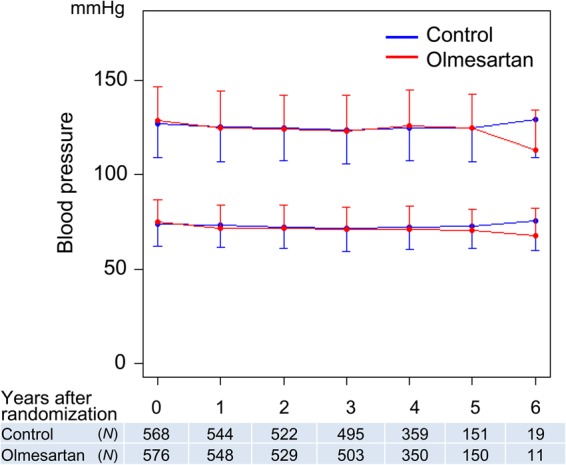
Time course in blood pressure. Blood pressure values are presented as mean ± standard deviations. There were no statistical differences in systolic or diastolic blood pressure at each point between the olmesartan and the control groups.

Time course in blood pressure. Blood pressure values are presented as mean ± standard deviations. There were no statistical differences in systolic or diastolic blood pressure at each point between the olmesartan and the control groups.