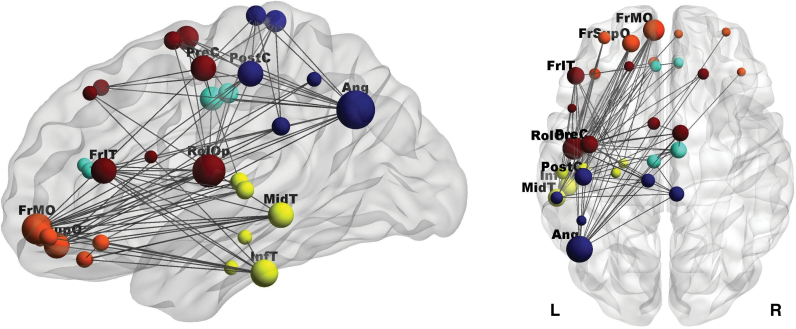
Fig. 1.
Network of increased resting-state gamma-band connectivity in patients with schizophrenia compared to healthy controls. The size of each node represents its number of connections within the network (degree). Labels are provided for nodes with at least 8 connections. As seen in table 1, these nodes are responsible for about 50% of interactions within the network. Ang, angular gyrus; FrIT, inferior frontal gyrus, pars triangularis; FrMO = medial orbitofrontal gyrus; FSupO, superior frontal gyrus, orbital part; InfT, inferior temporal gyrus; MidT, middle temporal gyrus; RolOp, rolandic operculum; PreC, precentral gyrus; PostC, postcentral gyrus. Color coding (online version only): inferior frontal and orbitofrontal cortex, orange; medial frontal cortex, light blue; lateral frontal cortex, red; remporal cortex and insula, yellow; parietal cortex, dark blue. The figure was created using BrainNet Viewer (http://www.nitrc.org/projects/bnv/, last accessed on Aug 8, 2014).

