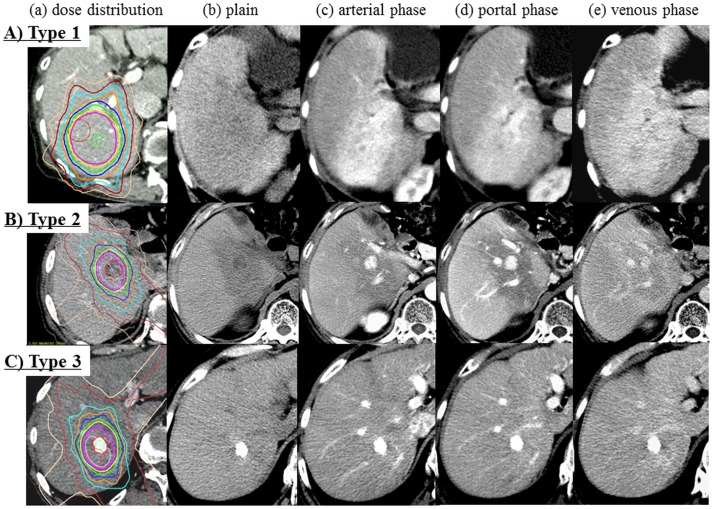
Fig 1. The dynamic CT appearance of focal liver injury following SBRT for HCC was classified into 3 types.
A) Type 1 (case 12, 10 months following SBRT). a) Dose distribution b) Plain c) Arterial phase d) Portal phase e) Venous phase. Hypodensity in plain CT and hyperdensity in all enhanced phases. B) Type 2 (case 39, 2 months following SBRT). a) Dose distribution b) Plain c) Arterial phase d) Portal phase e) Venous phase. Hypodensity in the arterial and portal phases and isodensity in the venous phase. C) Type 3 (case 51, 2 months following SBRT). a) Dose distribution b) Plain c) Arterial phase d) Portal phase e) Venous phase. Isodensity in the enhanced phases.

