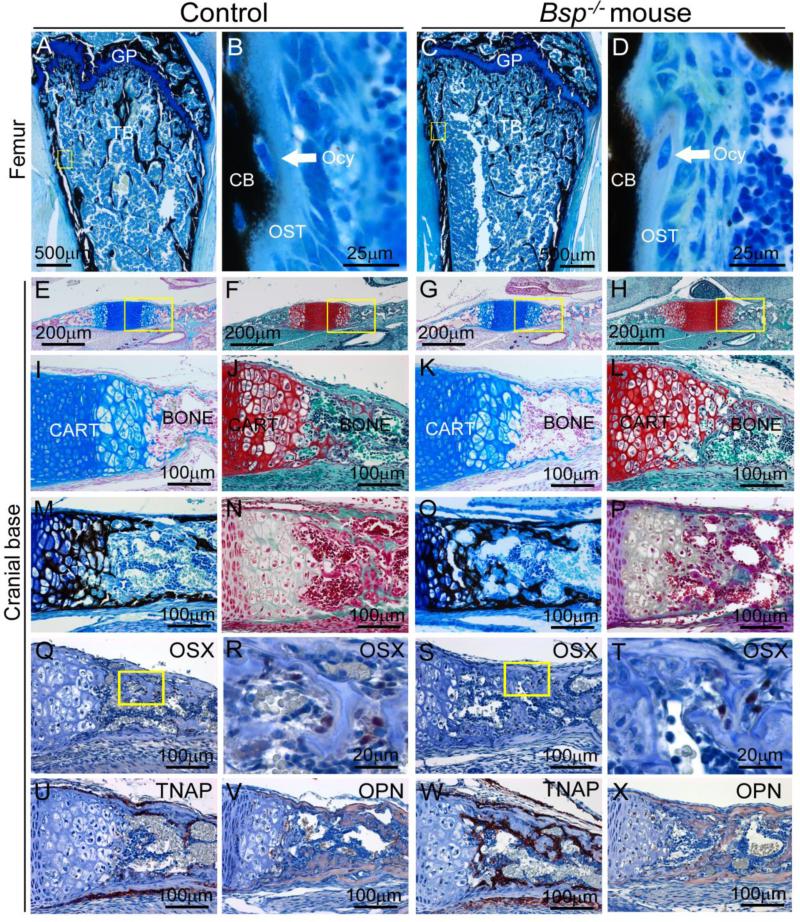
Figure 7. Effect of loss of BSP on endochondral ossification in the cranial base.
(A, B) At 1 mo, femurs of Bsp−/− mice have grossly normal morphology of the growth plate (GP), with increased trabecular bone (TB). High magnification of von Kossa stained sections shows no substantial accumulation of osteoid (OST) in the conversion to mineralized cortical bone (CB), a process in which osteocytes (Ocy) are embedded. Yellow boxes in A and C indicate areas shown under higher magnification in B and D, respectively. The remaining panels (E-V) feature the cranial base synchondrosis at 1 dpn, where yellow boxes in row E-H indicate areas shown under higher magnification in row I-L. Histological stains for cartilage, including alcian blue/nuclear fast red (E, I, G, K) and safranin-O (F, H, J, L) reveal no morphological differences in the cranial base cartilage between Bsp−/− and WT mice. Stains for mineralization status, including von Kossa (M, O) and Goldner's trichrome (N, P) do not reveal any substantial mineralization defects in Bsp−/− versus WT mice. In cranial base, no differences in early (Q-T) osteoblast marker osterix (OSX) expression are observed in Bsp null versus WT. Yellow boxes in Q and S indicate areas shown under higher magnification in R and T, respectively. (U, W) Tissue nonspecific alkaline phosphatase (TNAP) localization appears increased in Bsp null endochondral bone compared to WT. (V, X) Osteopontin (OPN) is present in endochondral bone matrix in WT and Bsp−/− mice.

