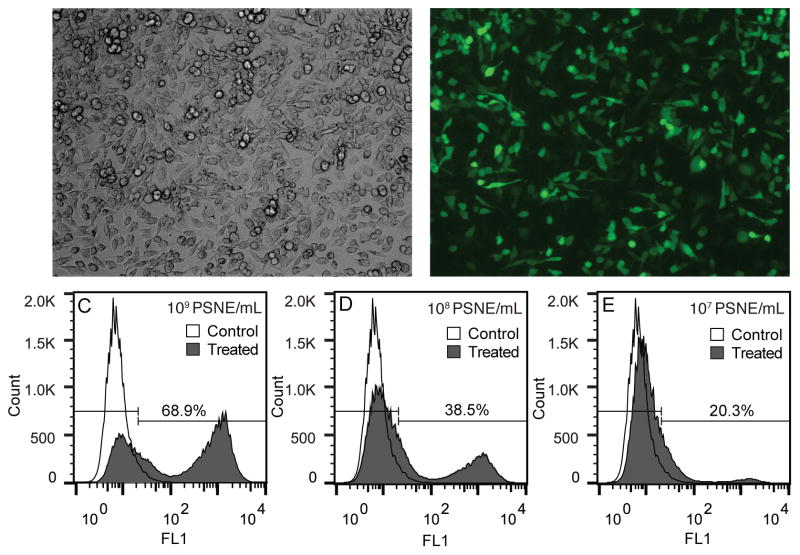
Figure 5.
Representative fluorescent microscopy and flow cytometry results from fluorescent small interfering RNA (siRNA) delivery experiments with phase-shift nanoemulsions (PSNE). (A) Brightfield and (B) fluorescent microscopy images of cells cultured for eight hours after ultrasound exposure testing the uptake of siRNA tagged with a green fluorophore. Flow cytometer results of siRNA uptake at (C) 1×10⁹, (D) 1×10⁸, and (E) 1×10⁷ PSNE/mL are shown in the bottom three histograms. Cells showing uptake of siRNA were gated using the FL1 (green) fluorescent intensity channel of the flow cytometer. The ultrasound parameters used were 5 cycle pulses, 250 Hz pulse repetition frequency, 100 second treatment duration, and a peak negative pressure of 6.2 MPa.

