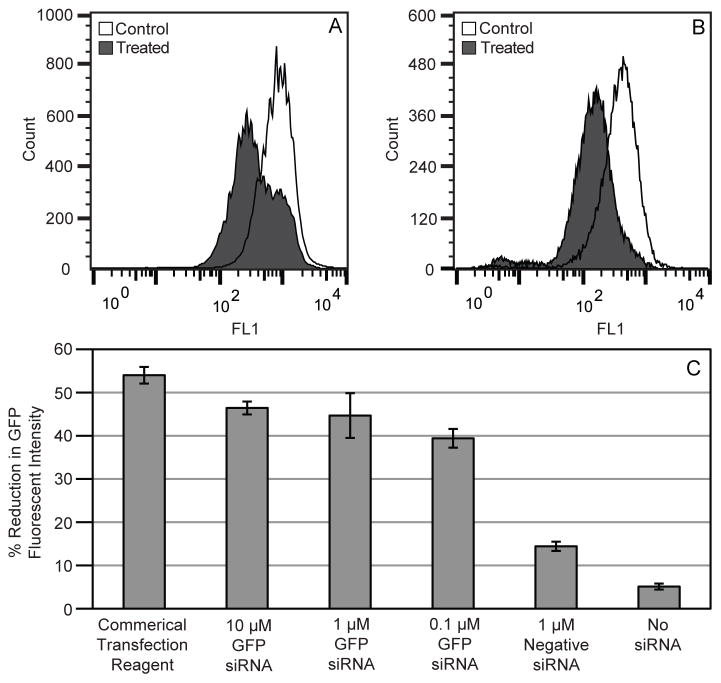
Figure 9.
Results from treatments using green fluorescent protein (GFP) targeted small interfering RNA (siRNA). Flow cytometer histogram results using a (A) commercial transfection agent and (B) acoustic cavitation mediated delivery with PSNE. The histograms depict treated and control cell populations with a treated cells showing decreased levels of GFP fluorescent intensity 48 hours post ultrasound treatment. (C) The bar plots show the overall reduction of GFP fluorescent intensity at various concentrations of GFP siRNA (10 μM, 1 μM, and 0.1 μM) and controls (commercial transfection agent, negative siRNA, and no siRNA). The ultrasound parameters used were 5 cycle pulses, 250 Hz pulse repetition frequency, 100 second treatment duration, and a peak negative pressure of 6.2 MPa.

