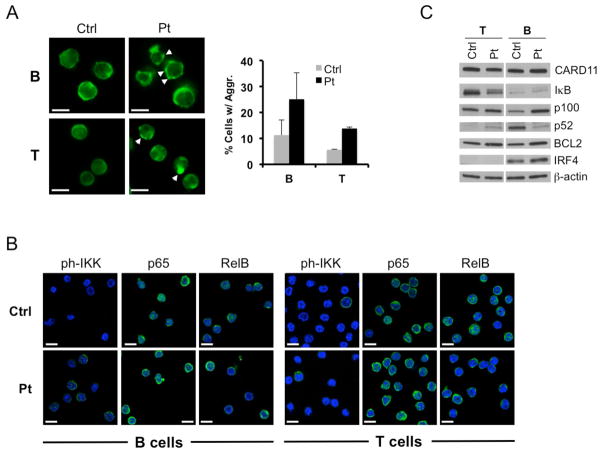
Figure 5. Evidence of marginally elevated CARD11-induced NF-κB signaling in patient lymphocytes.
(A) Confocal microscopy analysis of CARD11 expression (green) in purified B and T cells from the patient (Pt) and a normal donor (Ctrl). The percentage of cells with visible CARD11 aggregates (white arrowheads) was quantified by scoring ~200 cells from multiple fields. Scoring data represent mean ± standard deviation from two blinded scorers; p<0.03 (B cells), p<0.01 (T cells). Scalebars = 5 μm. (B) Confocal microscopy imaging of phospho-IKK, p65 (RelA) and RelB in control and patient lymphocytes. Scalebars = 5 μm. (C) Immunoblotting of total lysates from purified T cells and naïve B cells prepared from the patient (Pt) and a normal donor (Ctrl). Detected proteins are listed at right; β-actin serves as a loading control. Data are representative of two separate blood draws.

