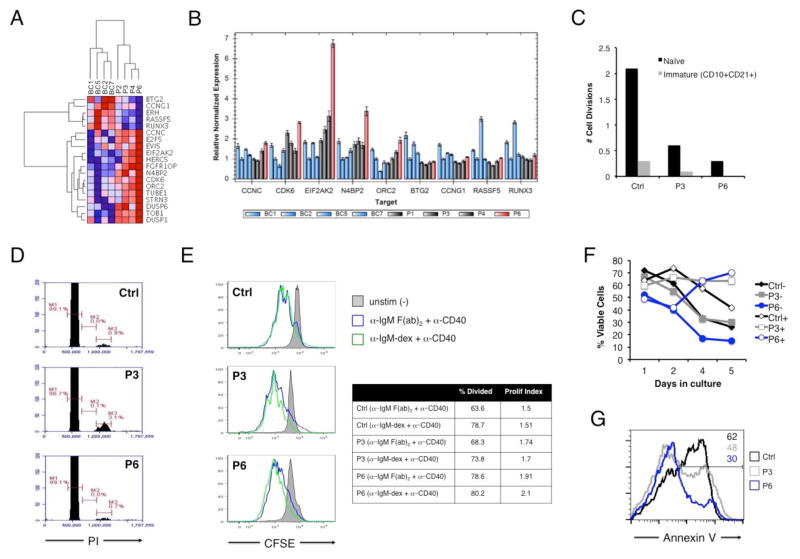
Figure 6. Comparative analysis of enhanced cell cycle progression and survival of patient B cells upon stimulation.
(A) Heat map of 19 differentially expressed cell cycle-related genes in naïve B cells from the patient (P6) relative to other BENTA patients and B cell controls. Color intensity represents fragments per kilobase per million (FPKM) values derived from paired-end RNA-Seq analysis. (B) Quantitative PCR validation of the expression of selected genes in controls versus BENTA patients, derived from the cell cycle signature outlined in (A). (C) KREC analysis of in vivo replication history (displayed as # of cell divisions) for sorted immature and mature naïve B cells from P6, P3, and a normal control. (D) Cell cycle profiling of naïve B cells from control, P3, and P6. Markers represent the percentage of cells in G1 (M1), S (M2), and G2/M (M3) phases of the cell cycle. Data in (C) and (D) are representative of two experiments. (E) CFSE dilution analysis of naïve B cells left unstimulated (gray filled histogram) or activated with anti-IgM F(ab)2 plus anti-CD40 (blue) or dextran-conjugated anti-IgM plus anti-CD40 (green) for 5 days. The percentage of divided cells and the proliferative index (total # of divisions/total # of dividing cells) are displayed at right for activated samples. Data are representative of three separate experiments. (F) Cell survival assays for naïve B cells purified from a normal control (black), P3 (gray), or P6 (blue) −/+ stimulation with anti-IgM F(ab)2 plus anti-CD40. Cell viability was measured over 5 days in culture. Data are representative of two separate experiments. (G) Quantitation of apoptotic cells following BCR stimulation. The percentage of Annexin V+ apoptotic cells (inset numbers) within the actively dividing population (based on CFSE dilution) from (F) was determined on day 5 by flow cytometry.

