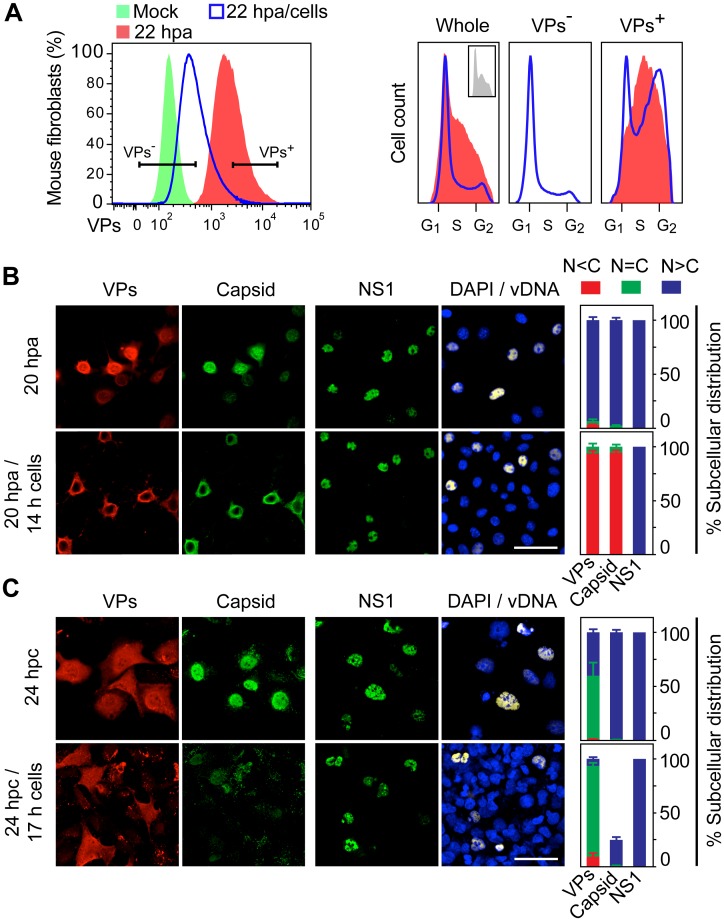
Fig 5. Cell density arrest signals perturb and may misplace MVM assembly.
A. Flow cytometry of G1/S synchronously infected MFs sampled at 6 hpa, 22 hpa, or at 22 hpa but with density-arrest imposed since 6 hpa by uninfected exogenous cells (22 hpa/cells), analyzed for VP expression (left), and for cell cycle distribution (cell count vs. DNA content) of non-expressing (VP-) and capsid proteins expressing (VP+) cells (right). VP- cells were not detected in 22 hpa samples. Inset: cell cycle distribution at 6 hpa. B. Confocal analysis of MFs synchronously infected by MVM showing the subcellular localization of viral antigens (VPs, Capsid, NS1), and viral genome replication (vDNA), at 20 hpa without or upon the previous addition of a saturating number of cells at 6 hpa (20 hpa/14 h cells). C. Similar analysis performed in HFs synchronously infected by density arrest without (24 hpc), or upon exogenous cell addition at 7 hpc (24 hpc/17 h cells). Scale bars 50 μm. The percentage of subcellular distribution of the viral antigens within the respective infected cell populations (VP+ staining) is shown on the right.

