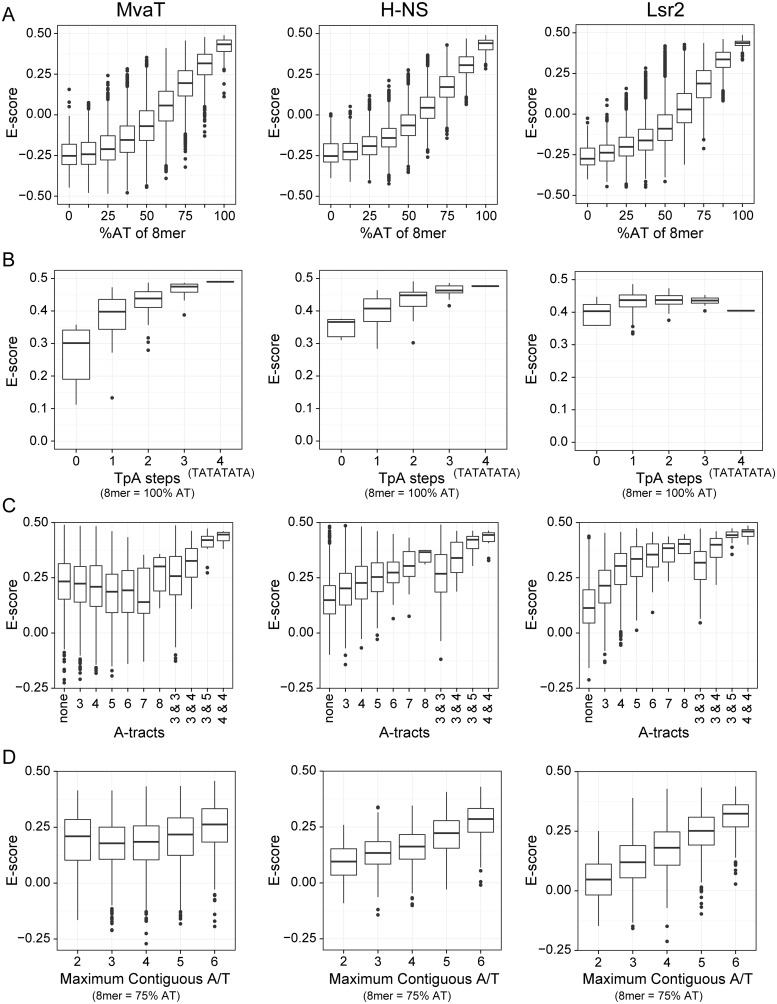
Fig 2. Protein binding microarray analysis of DNA binding preferences for MvaT, H-NS and Lsr2.
PBM data for H-NS and Lsr2 was previously published [29]. Tukey boxplots show the E-score distributions of the 8-mer oligonucleotide sequences and the whiskers indicate points within the 1.5 inter-quartile range. In all charts the sequence parameters are plotted against the E-score, which reflects relative affinity for a particular sequence. (A) E-score vs. AT-content of 8-mer target sequence. (B) Number of TpA steps for oligos containing only A or T (100% AT). (C) Length of A-tract sequence(s) in 8-mers with %GC ≥ 75. Some sequences contain two A-tracts (e.g. AAAGGAAA) and in those cases the length of each is indicated. (D) E-score vs. maximum length of uninterrupted A or T bases in a 75% AT sequence. Sequences such as GCAATAAT have 6 adjacent A or T bases while the longest stretch of adjacent A or T bases in the 8-mer AAGTTCAA is 2.

