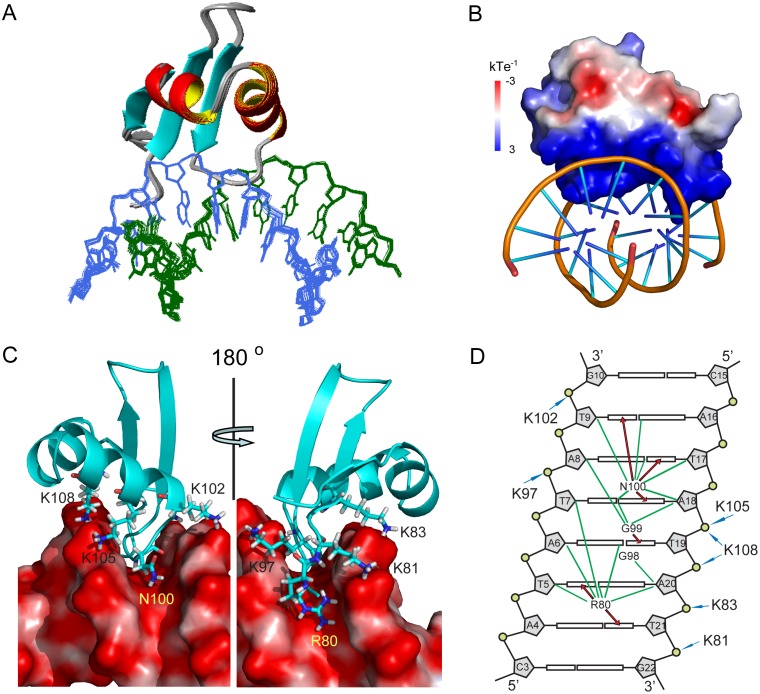
Fig 4. Structure of MvaTctd and AT-rich DNA complex.
(A) Superimposition for the ensemble of 20 structures of MvaTctd/DNA complex. Protein backbone is represented by ribbon and the target DNA is shown as lines. (B) Electrostatic potential of MvaTctd, calculated with APBS in the absence of DNA. (C) Close view of the binding interface. Residues of MvaTctd involved in DNA recognition are shown as sticks with one-letter amino acid code and residue number labeled. (D) Schematic representation of the intermolecular contacts. The DNA is drawn as a cylindrical projection viewed from the minor groove side. Hydrogen bonds between MvaTctd and DNA bases are indicated by red arrows. Green lines show the hydrophobic contacts. The interactions between positively charged lysine residues and DNA backbone phosphate groups are indicated by blue arrows.

