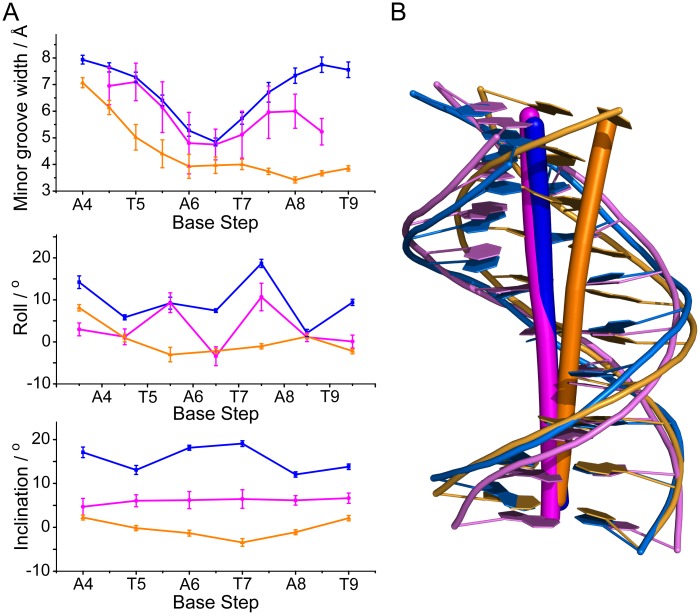
Fig 5. Analysis of MvaTctd-bound DNA conformation.
(A) Selected helix parameters of the solution structures of MvaTctd-bound 3AT DNA (blue), a free DNA with ATATAT sequence (PDB 2LWG) (magenta) and an A-tract DNA with AAAAAA sequence (PDB 1FZX [52]) (gold). Average minor groove width, roll and inclination angles including standard deviations are shown. Base steps of 3AT are indicated. (B) Mean structures of MvaTctd-bound 3AT (blue), 2LWG (magenta) and 1FZX (gold). Axes are shown by sticks.

