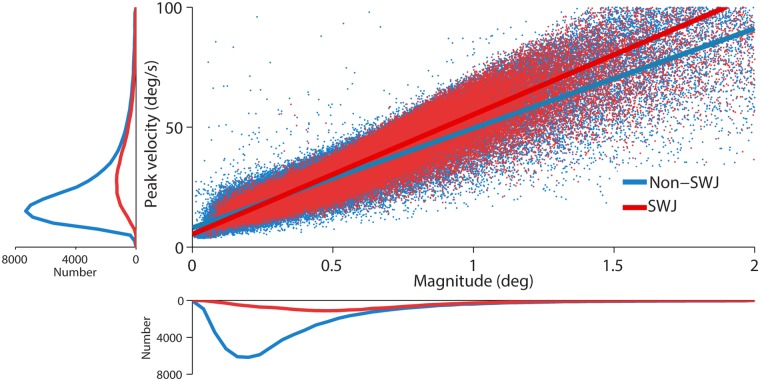
Fig 2. Peak velocity-magnitude relationship for SWJ saccades and non-SWJ saccades.
Main panel: Each dot represents a saccade with the peak velocity indicated on the y-axis and the magnitude on the x-axis. Color determines whether the saccade was part of a SWJ (red) or not (blue). Bottom panel: Average saccade magnitude distribution across monkeys (n = 5). Left panel: Average peak velocity distribution across monkeys (n = 5). Saccade magnitude and peak velocity were greater for SWJ saccades than for non-SWJ saccades (Z-values = 2.02; p-values = 0.04). The slopes of the peak velocity-magnitude relationships for SWJ saccades and non-SWJ did not differ statistically (Z-value = 0.14; p = 0.89).

