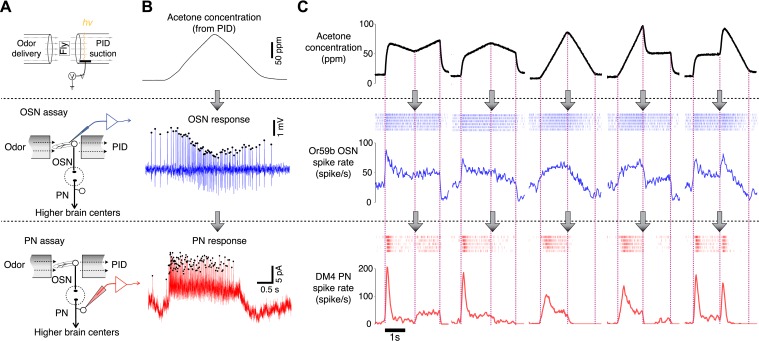
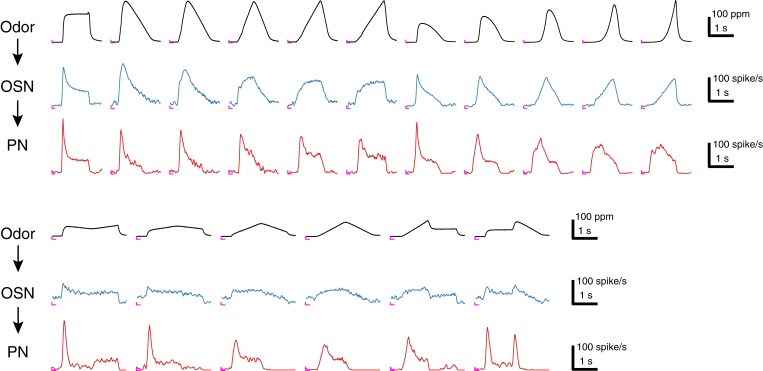
Figure 1. Dynamics of sample odor stimuli are significantly transformed along an odor-OSN-PN pathway.
(A) An experimental setup. Activity of OSNs and PNs was recorded in two different assays, which share the same odor delivery system. A photoionization detector (PID) provided real-time measurements of odor concentrations in every trial. (B) Sample traces of OSN and PN responses to a triangle-shaped odor concentration profile. (C) Sample OSN and PN responses to five distinct odor concentration waveforms. (Top row) Odor concentration profiles. Each trace is an average of six interleaved trials, recorded in the OSN assay. (Middle row) Raster and peristimulus–time histogram (PSTH) plots of the Or59b OSN response. (Bottom row) Raster and PSTH plots of the postsynaptic DM4 PN response to the same panel of odor stimuli.


