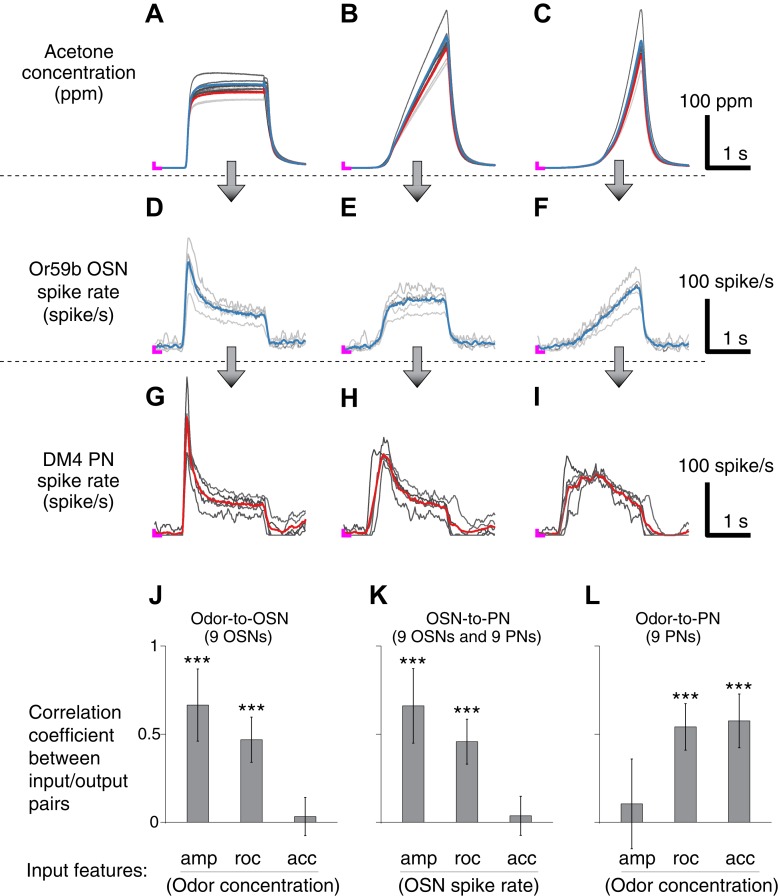
Figure 2. Correlation structures of olfactory information representations in odor, OSN and PN signals.
(A–C) Three polynomial odor stimuli: a pulse, a ramp and a parabola. Light gray lines represent individual trials from five different OSN experiments, and dark gray lines represent individual traces from five different PN experiments. Blue and red lines are average traces, respectively, from the OSN and PN experiments. An ‘L’ mark in magenta at the bottom left corner of each panel represents the zero amplitude point. (D–F) Or59b OSN response to the above stimuli (n = 5 flies). (G–I) PN response to the same set of stimuli (n = 5 flies). (J–L) Correlation analyses between three pairs of input and output (amp: amplitude, roc: rate of change, acc: acceleration). OSNs and PNs mainly encode the amplitude and rate of change of their feedforward inputs, whereas PNs most strongly represent the acceleration and rate-of-change components of the odor input. Results with error bars indicate mean ± standard deviation, and ***indicates p < 0.001 (t-test). n = 9 flies for each analysis, 5 flies from the above traces and 4 flies from the same experiment at half concentration (data not shown).


