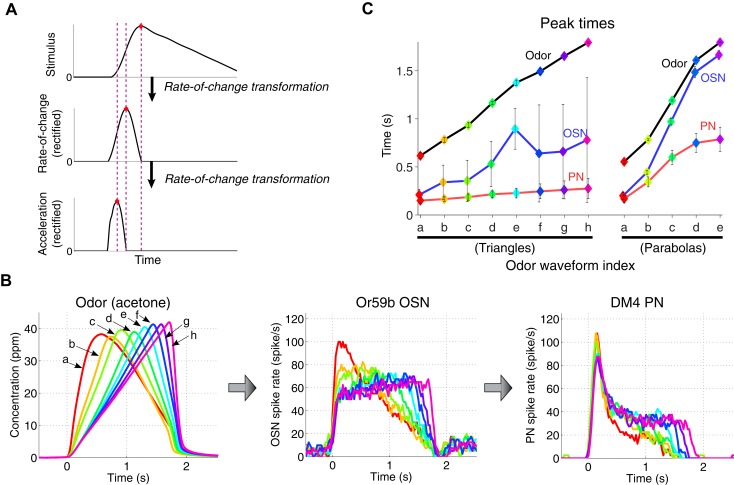
Figure 4. A cascade of rate-of-change encodings leads to a rapid detection of the stimulus onset.
(A) A cascade of two rate-of-change transformations leads to the advancement of the peak time near to the stimulus onset, in response to a triangle-shaped input. At each stage, the rate of change of the input was computed, and the output was half-wave rectified. (B) 8 triangle-shaped acetone concentration waveforms (left) and the corresponding OSN and PN responses. (C) The peak times for odor, OSN, and PN signals. The advancement in peak times was observed in both the odor-to-OSN and OSN-to-PN transformations. Peak times were color coded so that the color of the marker matches that of the associated triangle signals in (B) and parabola signals in Figure 3 (A). n = 5 OSNs and n = 4 PNs for both triangles and parabolas. Results with error bars indicate mean ± standard deviation.

