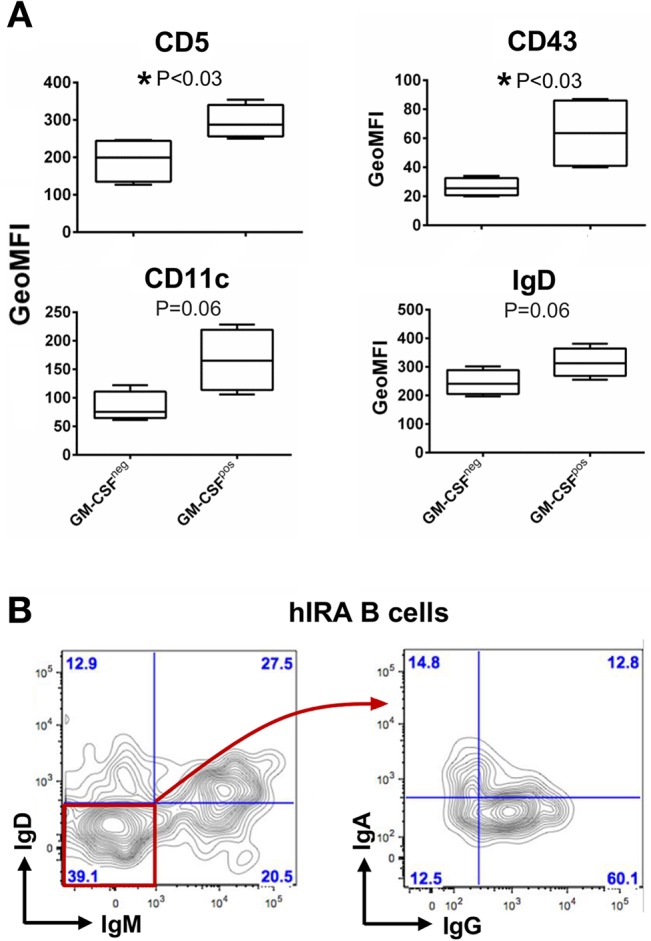
Fig 4. Phenotypic properties of hIRA B cells from tonsils.

Conventional CD19+CD20+GM-CSF-(GM-CSFneg) and hIRA CD19+CD20+GM-CSF+(GM-CSFpos) B cells in cell suspensions from tonsils were analyzed by flow cytometry. A) Expression of CD5, CD43, CD11c and IgD in GM-CSFneg versus GM-CSFpos cells. The graphs show the geometric mean of fluorescence intensity (GeoMFI) for each marker after isotype background subtraction. Means and standard deviations are shown. P value was calculated using the non-parametric Mann–Whitney test (n = 4). B) Ig subclasses were analyzed within the hIRA B cell population. The plots are representative of n = 4.
