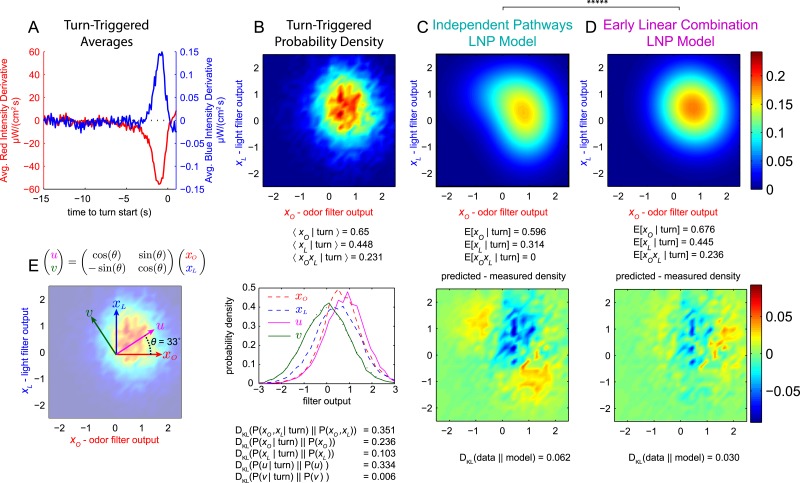
Figure 3. Multi-modal reverse-correlation experiments suggest attractive odor and light signals are combined linearly and early.
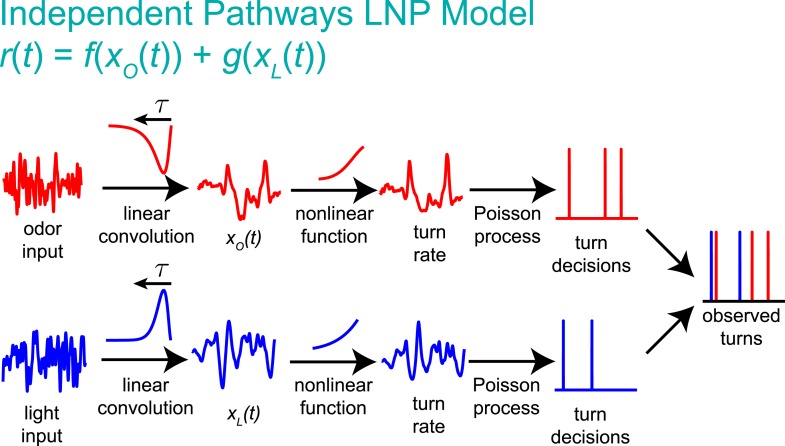
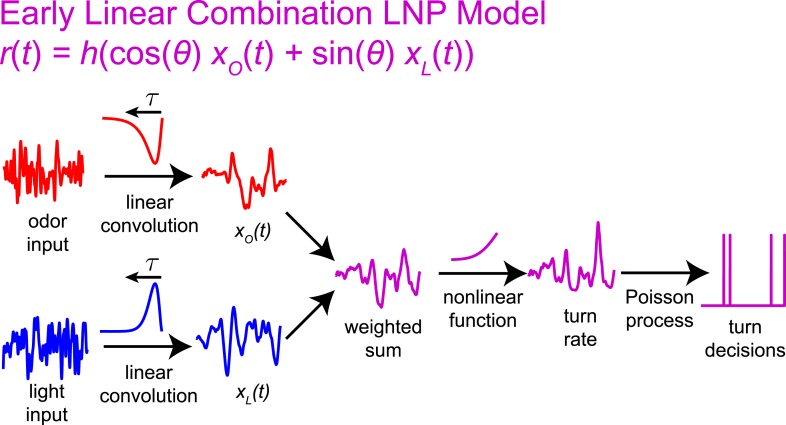
Or42a>CsChrimson larvae were presented with independently varying Brownian light intensities. Reverse-correlation analysis was carried out as in Figure 1. (A) TTA. Average change in red (fictive odor) and blue light intensities preceding turns. (B) Turn triggered ensemble. Top: 2D density histogram of calculated odor and light filter outputs at initiation of each turn. Bottom: 1D density histograms of filter outputs (xO,xL) and their linear combinations (u,v). DKL(P(x|turn)||P(x)) is the Kullback-Leibler divergence from the turn-triggered distribution to the distribution of x at all times. Larger values indicate that x carries more information about the decision to turn. (C, D) Predicted turn triggered ensemble according to, (C) independent pathways model and (D) early linear combination model. Top panel: predicted density. Bottom panel: difference between predicted density and measured density. DKL(data||model) is the Kullback-Leibler divergence of the model from the data; smaller values indicate a better match. ***** = P (Independent pathways model)/P (Early linear combination model) < 0.00001; Aikake Information Criterion Test. (E) Coordinate rotation described in text and used in bottom panel of B. Orthogonal coordinates (u,v) are rotated 33° relative to (xO,xL). Rotation is shown overlaid on turn-triggered probability density (B). See Table 1 for number of experiments, animals, and so on.


