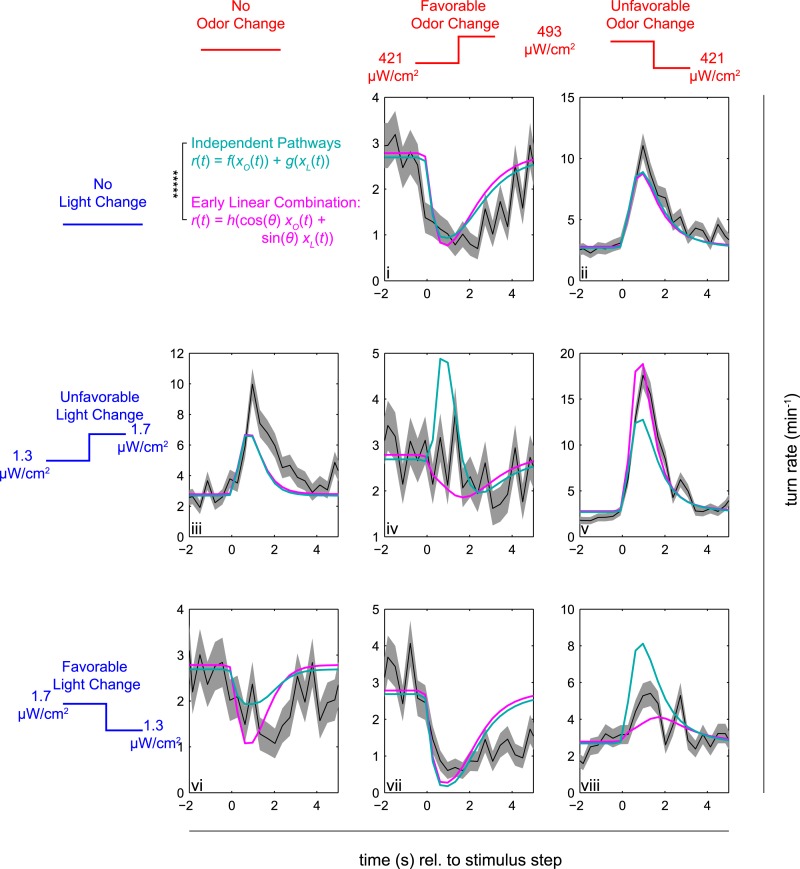
Figure 4. Multi-modal step responses support early linear combination of odor and light signals.
Turn rates vs time for Or42a>CsChrimson larvae responding to coordinated increases and decreases of red and blue light. All steps occur at t = 0. Left column: no change in fictive odor, center column: red light increases at t = 0 right column: red light decreases at t = 0. Top row: no change in visual stimulus, center row: blue light increases at t = 0, bottom row: blue light decreases at t = 0. For instance, in panel iii blue light increased at time 0, while red light remained constant; in iv, both red and blue light increased at time 0; and in v, blue light increased and red light decreased at time 0. Black line and shaded region represent mean turn rate and standard error due to counting statistics. Cyan line is the best-fit (maximum likelihood estimate, 6 parameter fit) prediction of the independent pathways model. Magenta line is the best-fit (maximum likelihood estimate, 4 parameter fit) prediction of the early linear combination model. Note that the time axis is the same for each subplot, but the turn rate axis varies. ***** = P (Independent pathways model)/P (Early linear combination model) < 0.00001; Aikake Information Criterion Test, measured for the entire data set. See Table 1 for number of experiments, animals, and so on.

