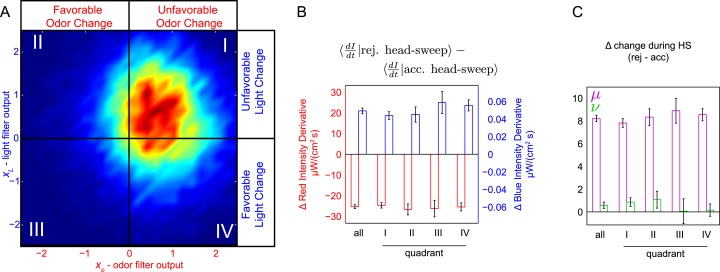
Figure 6. Probing for attentional shifts during multi-modal noise experiments.
(A) Turn-triggered ensemble (duplicated from Figure 3B), with quadrants highlighted. Color scale the same as in 3B. Quadrants I–IV indicate which stimulus or stimuli likely provoked the larva to turn (I—both odor and light stimulated turning; II—light, but not odor, stimulated turning; III—neither odor nor light were changing unfavorably; IV—odor, but not light, stimulated turning). Each turn was assigned to one of these quadrants based on the filtered signal values (xO,xL) at the time the turn started. (B, C) Difference in intensity changes during accepted and rejected head sweeps (first head-sweep of turn only). Difference in mean rate of change in intensity over mean head sweep duration (1.25 s, shaded region in 5C) between rejected and accepted head-sweeps. Error bars are ±1 s.e.m. (B) Changes in odor and light intensities. (C) Changes in rotated coordinate system. See Table 1 for number of experiments, animals, and so on.

