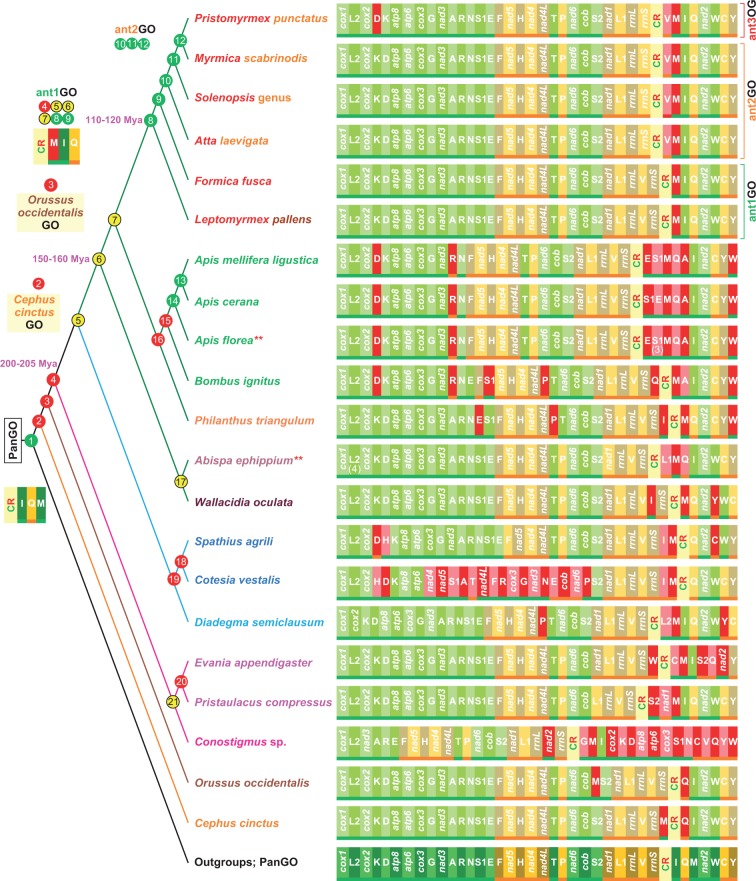
Fig. 4.—
The evolution of GOs in Hymenoptera. Nodes are colored according the output of the TreeREx program (Bernt et al. 2008). Green node, consistent node. Yellow node, 1-consistent node; red node, fallback node. The different colors reflect the level of uncertainty that characterizes the reconstruction of the GO. The red nodes exhibit the highest level of uncertainty with respect to alternative GOs, whereas yellow and green nodes are more reliable in their reconstructions. The GO reconstructions are provided solely for nodes that are pivotal to this article. For a detailed reconstruction for all nodes, included the TreeREx scores see the supplementary figure S3, Supplementary Material online. *, multiple copies of S1 (3) considered just once in the TreeREx analysis; **, multiple copies of L2 considered just once in TreeREx analysis. The dating times are expressed in millions of years and were obtained from Grimaldi and Engel (2005). The genomic and genetic nomenclature, as well as the color scheme, are the same as in figure 1. The genes that changed their position relative to PanGO are shown with a pink/red background.

