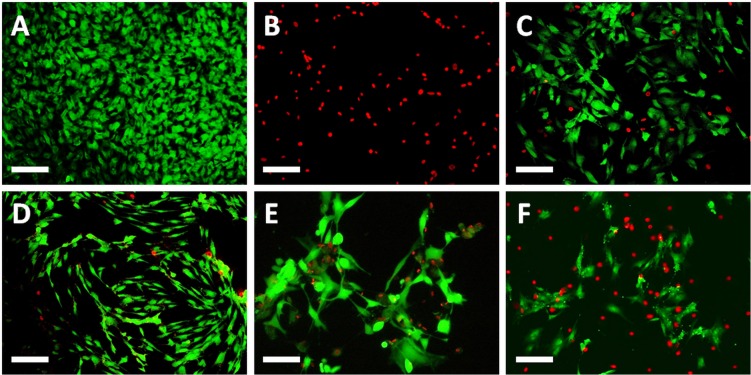
Fig 4. Illustrative images corresponding to the analysis of cell viability and functional status according to the LIVE/DEAD assay in conjunctival cells incubated with different PGAs dilution for different times.
A: negative controls for cytotoxicity; B: positive controls for cytotoxicity; C: cells incubated with a 25% concentration of bimatoprost for 1 h; D: cells incubated with a 25% concentration of tafluprost for 1 h; E: cells incubated with a 25% concentration of travoprost for 1 h; F: cells incubated with a 25% concentration of latanoprost for 1 h. Scale bars: 100 μm.

