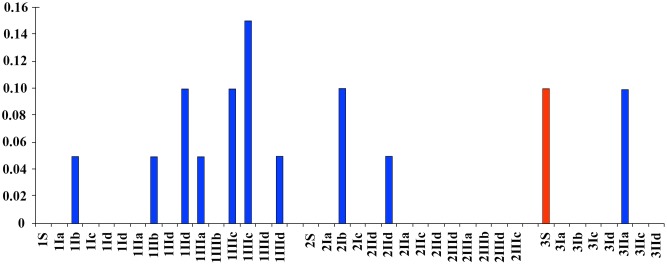
Fig 4. Eschericia coli.

The concentrations of E. coli (CFU/ml) found at different sites, depths and habitat typologies. The surface samples are shown in red. Arabic numbers represent the sampling site. Roman numbers represent the sampling depth; the sampling depths were I—10 cm, II—25 cm, III -45 cm. The letters indicate the following: a—up riffle, b—down riffle, c—lateral side on pools, d—sand accumulation areas (bars, curves).
