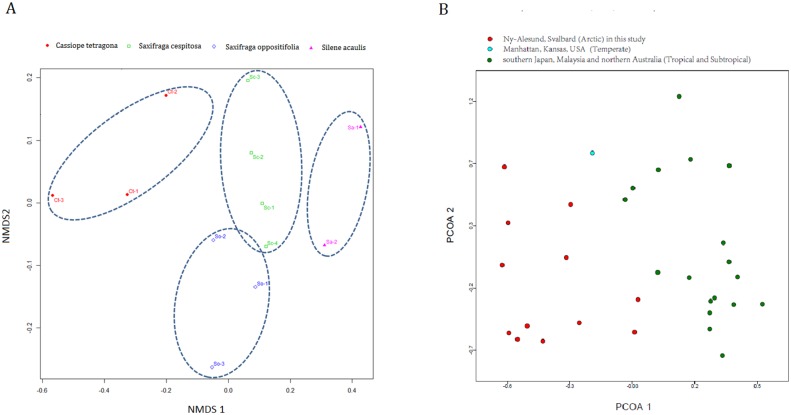
Fig 4.
A. Nonmetric multidimensional scaling (NMDS) ordination based on Bray-Curtis-transformed abundance data for OTUs. Each point corresponds to a sample. The different colors/symbols represent the four vascular plant species. B. Principal coordinate analysis (PCoA) of the 12 samples in this study (red) compared to 19 samples from other environments (other colors).

