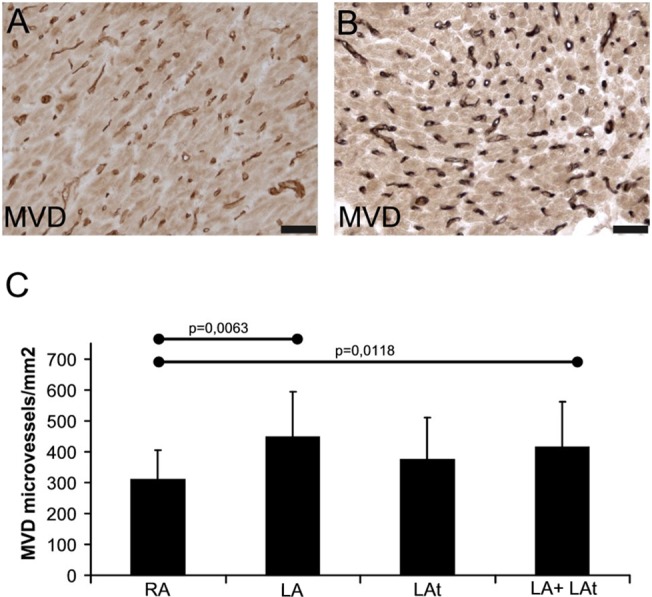
Fig 5. Quantification of microvascular density.

Histochemical visualization of microvasculature using UEA-lectin binding in atrial myocardium from patients with sinus rhythm (SR) (A) and atrial fibrillation (AF) (B). Peroxidase reaction with DAB as a substrate (brown precipitate). No nuclear counterstaining. Scale bar in A-B = 50μm. (C) A graph showing results of quantification of microvascular density (MVD) in atrial samples of all patients as described in Methods. RA–right appendage (n = 24), LA–left appendage (n = 12), LAt–left atrium (n = 10), LA + LAt (n = 22).
