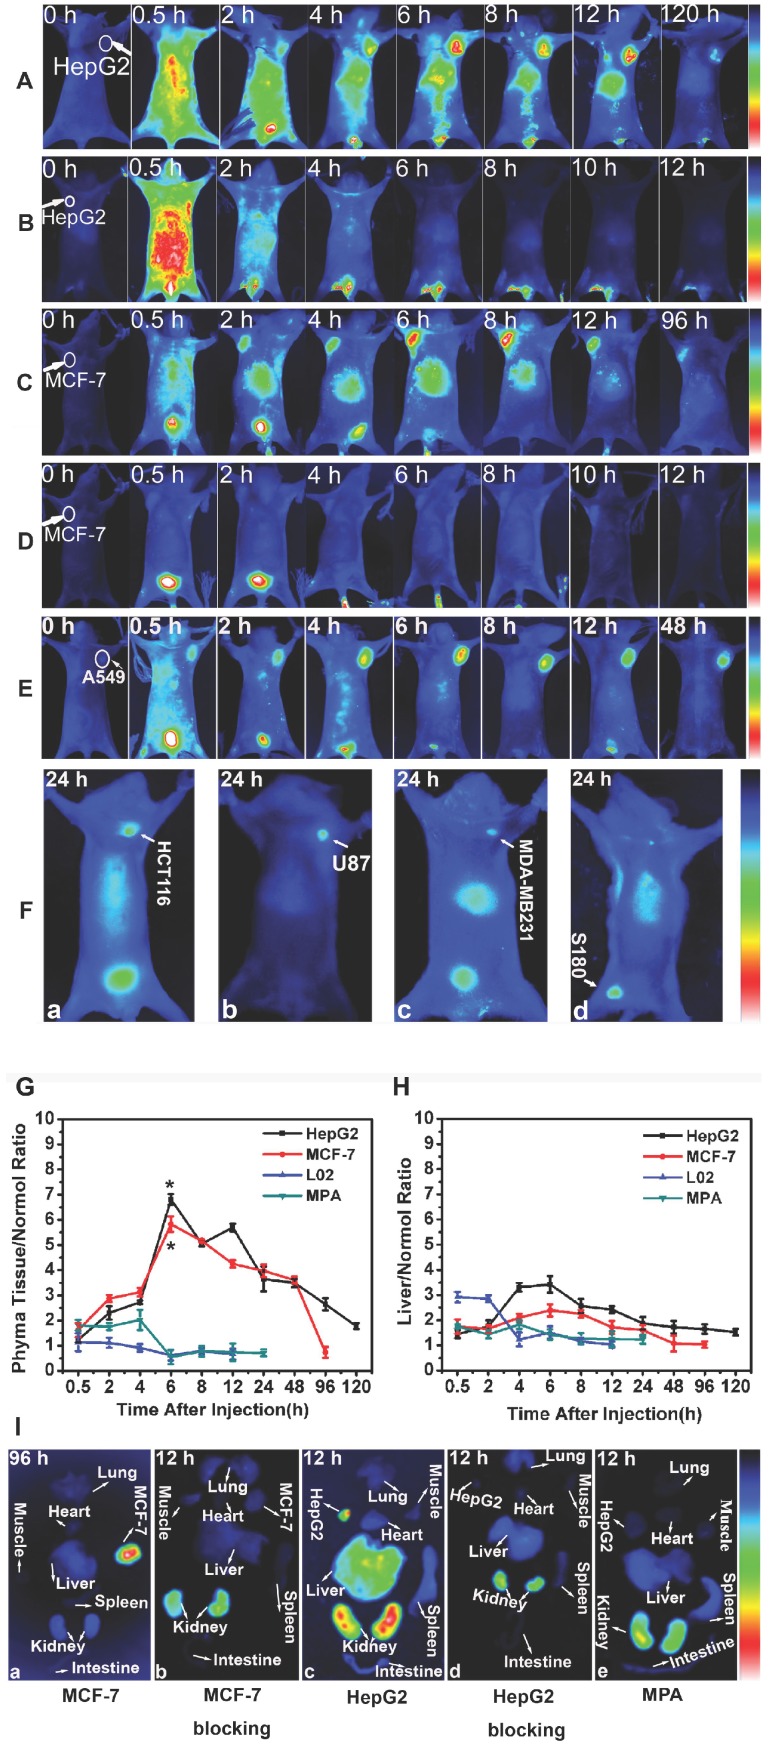
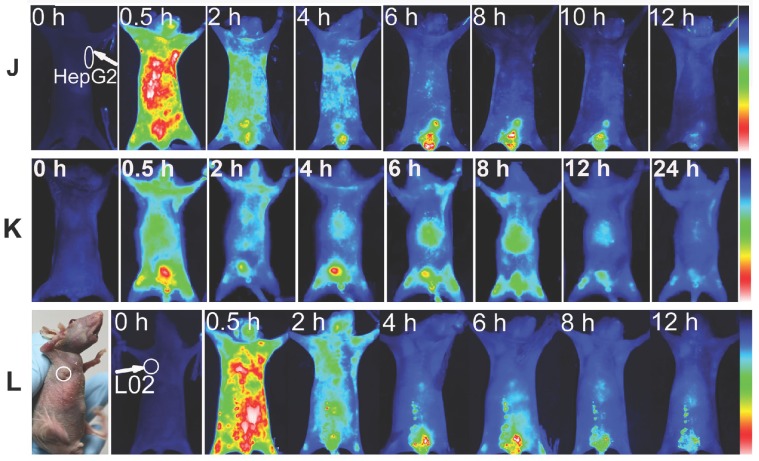
Figure 7.
In vivo NIR fluorescence imaging. Target or block experiment of Gal-MPA at different post-injection time intervals in (A, B) HepG2 tumor-bearing mice, (C, D) MCF-7 tumor-bearing mice and (E) A549 tumor-bearing mice. The blocking experiments (B, D) were performed by injecting Gal into the tail vein of nude mice at 0.5 h before Gal-MPA injection. (F)Target experiment of Gal-MPA at 24 h post-injection in (F-a) HCT116, (F-b) U87, (F-c) MDA-MB-231 and (F-d) S180 tumor-bearing mice. (G) Statistical comparison of phyma tissue-to-normal tissue (P/N) ratio of samples in mice. (H) Liver-to-normal tissue (L/N) ratio of samples in mice. (I) Fluorescence images of isolated organs separated from different tumor-bearing mice:(I-a Organs separated from MCF-7 tumor-bearing mouse at 96 h after injecting Gal-MPA. I-b Organs separated from the blocking experiment at 12 h for MCF-7 tumor-bearing mice. I-c Organs separated from HepG2 tumor-bearing mouse at 12 h after injecting Gal-MPA. I-d Organs separated from the blocking experiment at 12 h for HepG2 tumor-bearing mice. I-e Organs separated from HepG2 tumor-bearing mouse at 12 h after injecting MPA.) (J) Fluorescence images of nude mice bearing HepG2 tumor with injection of MPA. (K) Fluorescence images of normal mice with injection of Gal-MPA. (L) In vivo fluorescence images of Gal-MPA in nude mice bearing L02 normal explant at different post-injection intervals.


