. 2015 May 18;4:e06041. doi: 10.7554/eLife.06041

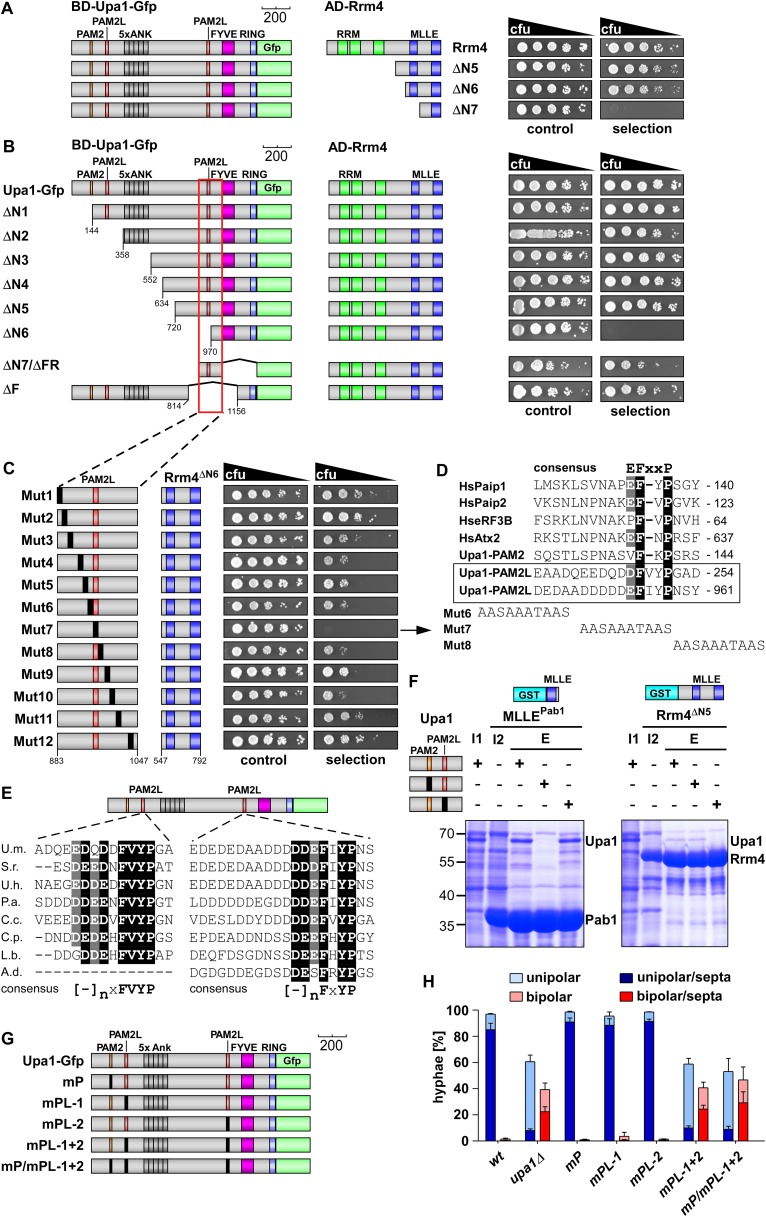
Figure 3. Upa1 contains two PAM2L motives for interaction with Rrm4.

(A) Two-hybrid analysis with schematic representation of variants tested (left) and growth plates (right). Yeast cultures were serially diluted 1:5 (decreasing cfu) and spotted on respective growth plates assaying for reporter gene expression. (B) Two-hybrid analysis as in (A). Red rectangle indicates minimal region in Upa1 interacting with Rrm4. (C) Two-hybrid analysis as in (A). Upa1 region identified in (B) was analysed by linker scanning mutagenesis (mutations indicated as black bar, Mut1-12). (D) Comparison of PAM2 and PAM2L sequences as in Figure 1B. Note, the second PAM2L motif was only mutated in Mut7 (E) PAM2L sequences of Upa1 compared to related sequences from basidiomycetes (U.m., Ustilago maydis UMAG_12183 / XP_758247.1; S.r., Sporisorium reilianum, accession number sr13323 / CBQ72642.1; U.h., Ustilago hordei accession number UHOR_03,485 / CCF52210.1; P.a. Pseudozyma antarctica GAK65366.1; C.c. Coprinopsis cinerea CC1G_00,427 / XP_001837291.2; C.p. Coniophora putanea XP_007767511.1; L.b. Laccaria bicolor XP_001876756.1; A.d. Auricularia delicate XP_007337909.1). (F) GST co-purification experiments with components expressed in E. coli N-terminal His6-tagged versions of Upa1, Upa1mP, and Upa1mPL (amino acids 1–363) were expressed to the same level (first input lane, I1; see Figure 3—figure supplement 5B). MLLE domains of Pab1 or Rrm4 (MLLEPab1 or Rrm4ΔN5, respectively) were expressed as GST fusion proteins (second input lane, I2). After GST affinity chromatography proteins were eluted (lanes marked with "E"). Interaction studies were performed with whole protein extracts from E. coli to demonstrate specific binding. (G) Schematic representation of Upa1 variants carrying mutations (black boxes) in the PAM2 and PAM2L regions. (H) Percentage of hyphae (8 h.p.i.): unipolarity, bipolarity, and septum formation was quantified (error bars, s.e.m.; n = 3 independent experiments, >100 hyphae were counted per experiment; note that septum formation is given relative to the values of unipolar or bipolar hyphae set to 100%).

DOI: http://dx.doi.org/10.7554/eLife.06041.007

Figure 3.

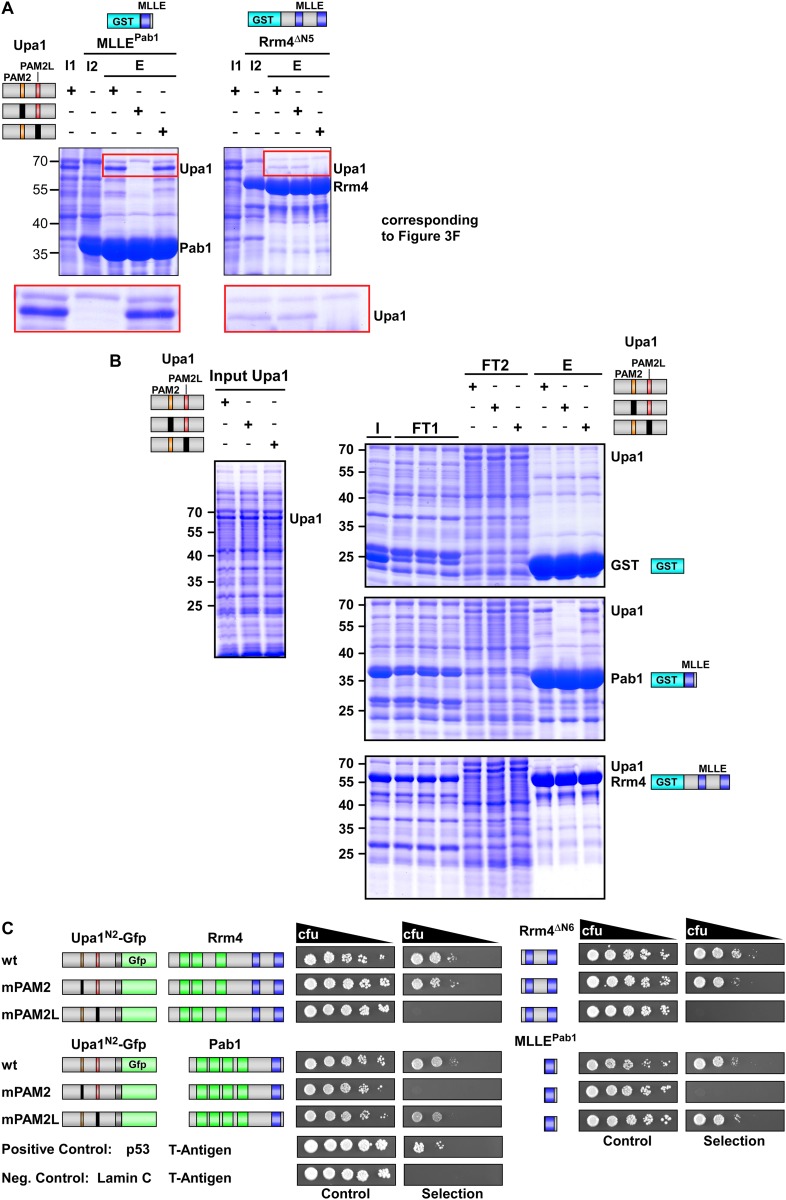
Figure 3—figure supplement 1. Upa1 interacts with Rrm4 in vivo.

Figure 3—figure supplement 1.

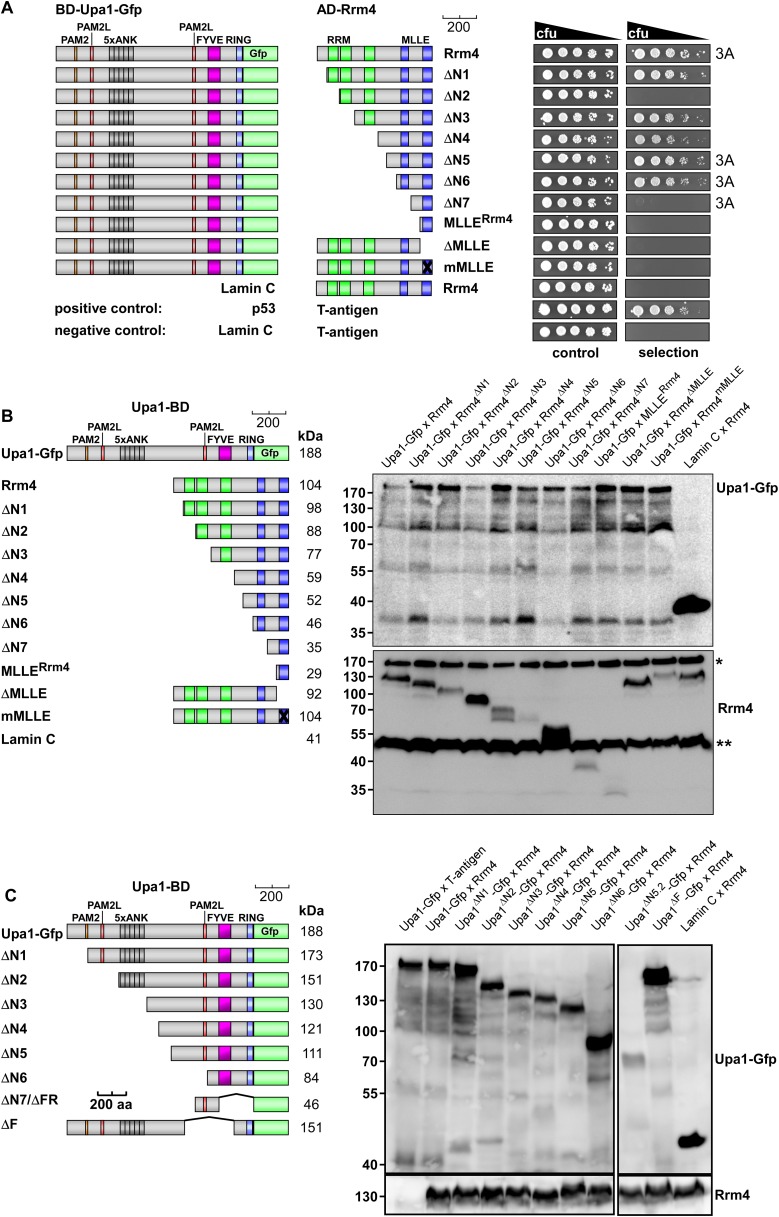
Control experiments for the detailed two-hybrid analysis given in Figure 3. (A) Two-hybrid analysis mapping the domain in Rrm4 that interacts with Upa1 was carried out as described in Figure 3. Positive and negative controls (interaction of p53 with T-Antigen and Lamin C with T-Antigen, respectively) were recommended by the provider of the Matchmaker 3 system (Clontech). Note that Rrm4ΔN2 failed to interact with Upa1-Gfp for unknown reasons. (B) Western blot analysis of yeast extracts expressing Upa1-Gfp and Rrm4 variants (given above the lanes) carrying a Myc tag and a HA epitope tag, respectively. * and ** mark cross reacting proteins. Schematic representation of variants is given on the left. (C) Western blot analysis of yeast extracts expressing Upa1-Gfp variants (schematically shown on the left) and Rrm4 (given above the lanes). Upa1-Gfp was detected with αc-Myc-antibody and Rrm4 with αHA-antibody.
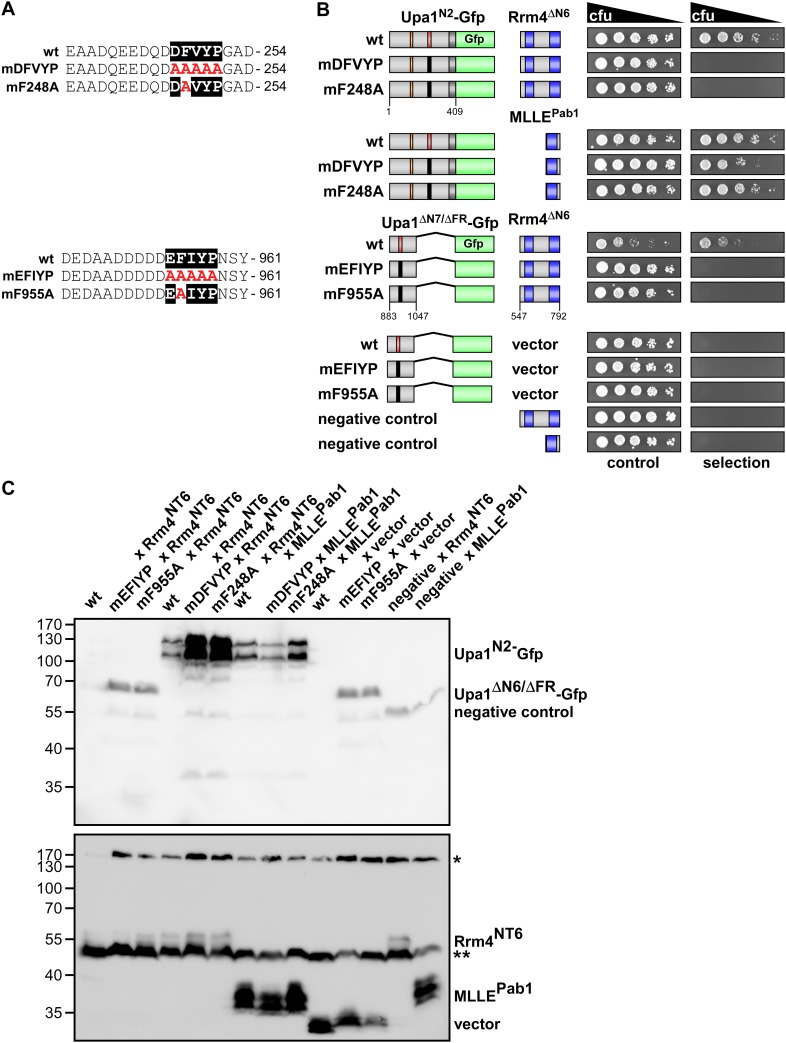
Figure 3—figure supplement 2. The evolutionarily conserved core of both PAM2L motifs is essential for interaction with Rrm4.

Figure 3—figure supplement 2.

(A) Sequences of the PAM2L motifs from Upa1 (conserved core in white and alanine mutations are given in red). (B) Two-hybrid analysis with schematic representation of variants tested (left) and growth plates (right). Yeast cultures were diluted 1:5 (decreasing colony forming units, cfu) and spotted on respective growth plates assaying for reporter gene expression. (C) Western blot analysis of yeast extracts expressing Upa1-Gfp and Rrm4 variants (given above the lanes) carrying a Myc tag and a HA epitope tag, respectively. * and ** mark cross reacting proteins. Schematic representation of variants is given in B.
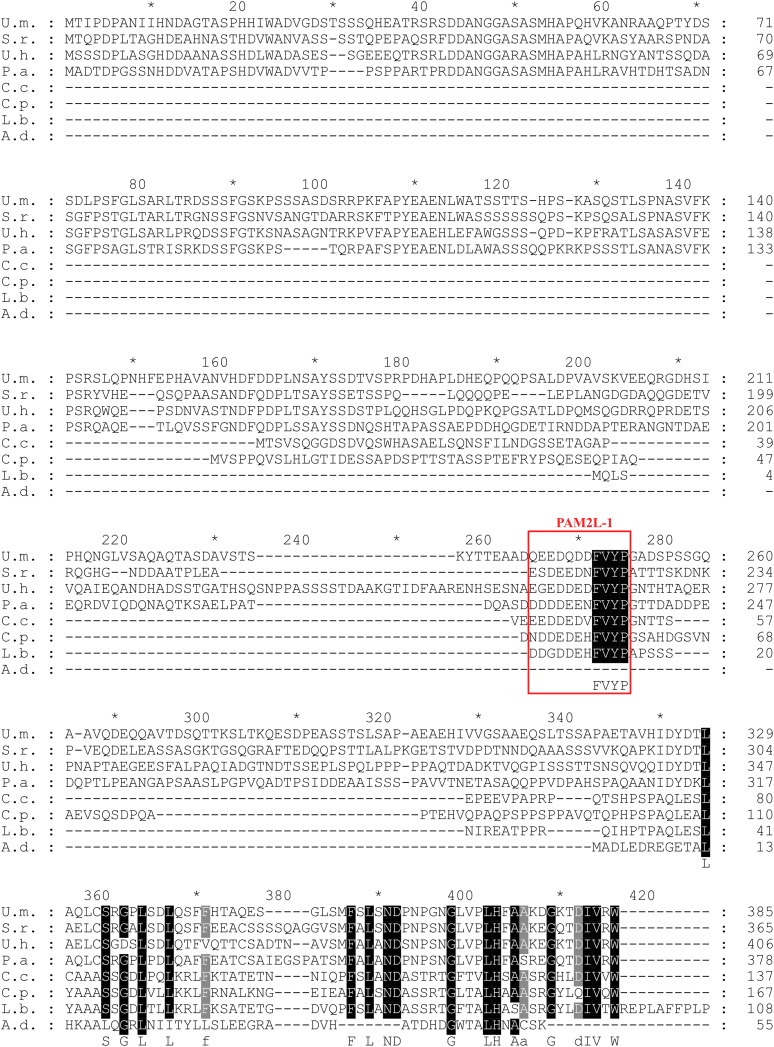
Figure 3—figure supplement 3. Conserved PAM2L motif in the Upa1 N-terminal region.

Figure 3—figure supplement 3.

Sequence comparison of Upa1 homologues of various basidiomycetes (names and accession numbers are given in Figure 3). Remarkably, the FVYP sequence of PAM2L (red box) is the only conserved region at the N termini.
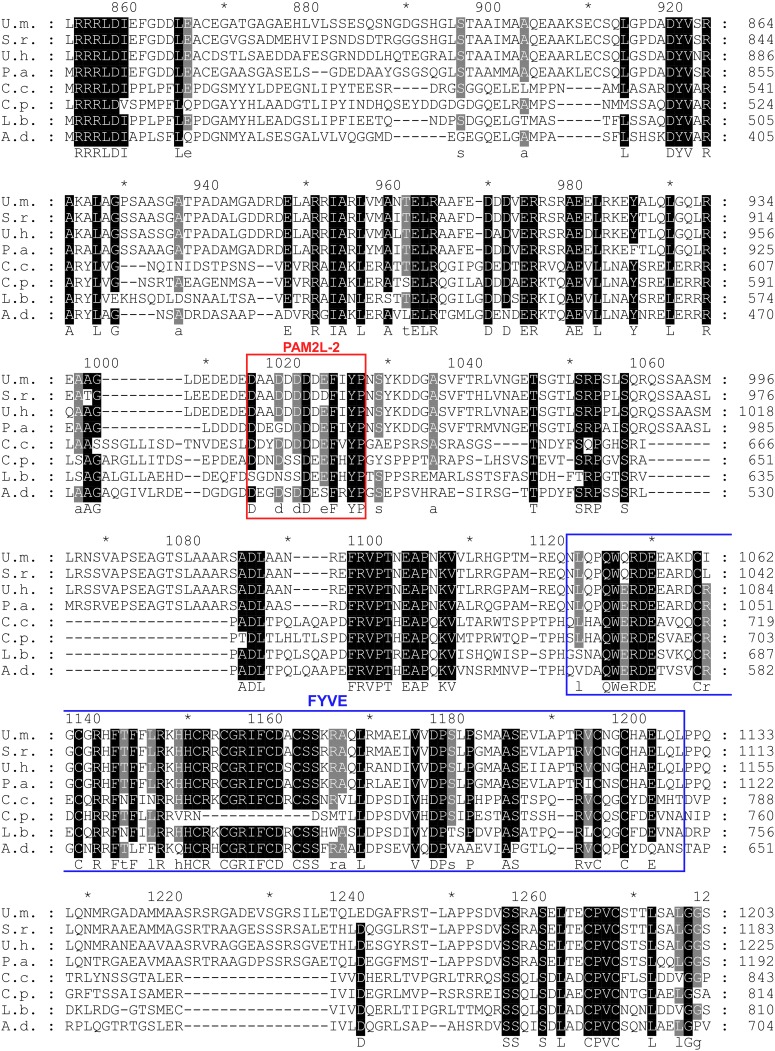
Figure 3—figure supplement 4. Conserved PAM2L motif in the central region of Upa1.

Figure 3—figure supplement 4.

Sequence comparison of Upa1 homologues from various basidiomycetes (names and accessions numbers given in Figure 3). The FxYP sequence of PAM2L (red box) is conserved in the central part. The computationally predicted FYVE zinc finger domain is given in blue (SMART; Letunic et al., 2009).
Figure 3—figure supplement 5. Sequence specific recognition of the PAM2 and PAM2L sequence with the MLLE domains of Pab1 and Rrm4, respectively.

Figure 3—figure supplement 5.

(A) Results of Figure 3F are given with the important region enlarged showing the co-purifying Upa1 variants (red boxes). (B) Coomassie stained SDS-PAGE gels of protein fractions analysed by GST-pulldown assays shown in Figure 3F. On the left side, protein extracts of E. coli expressing all variants of His6-Upa1 are shown. The corresponding band is labelled. Please note, that these proteins—like all variants of Upa1—exhibit a band at a higher kDa size than predicted. On the right side, experimental steps of the pulldown experiment are shown (I = Input; FT1 = flow through 1; FT2 = flow through 2; E = elute of bound proteins). The band height of each protein is indicated on the right. (B) Two-hybrid analysis with schematic representation of variants tested and growth plates as described in Figure 2. Variants of a N-terminal region of Upa1 (Upa1N2; amino acid 1 to 408) carrying no mutation (wt), a mutation in the PAM2 motif (mPAM2) or a mutation in the PAM2L motif (mPAM2L), were tested against full length as well as MLLE-containing versions of Rrm4 and Pab1.
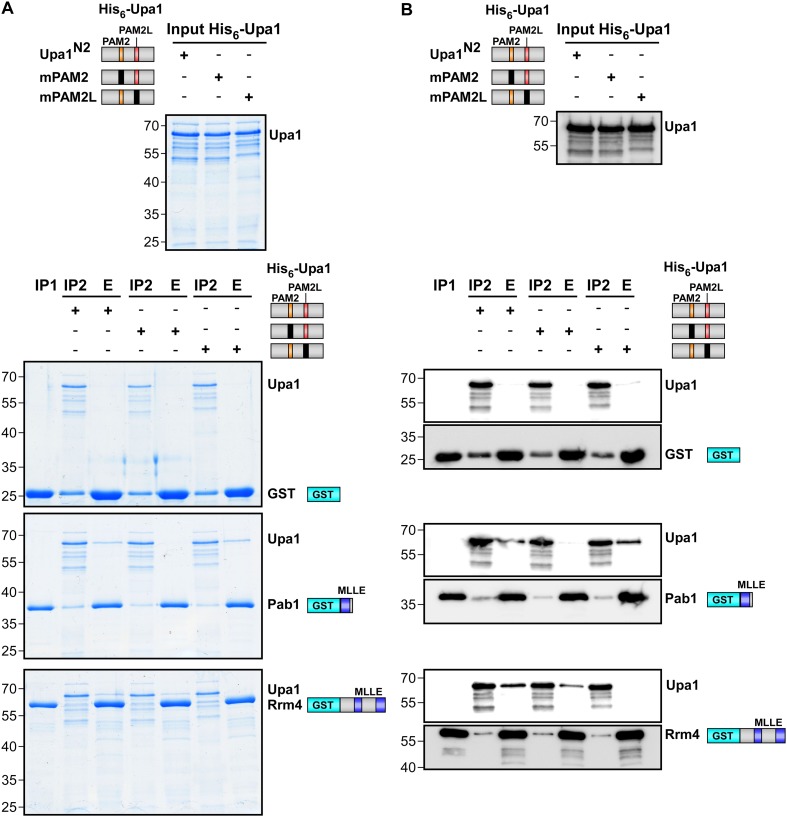
Figure 3—figure supplement 6. Sequence specific recognition of the PAM2 and PAM2L sequence with the MLLE domains using purified components.

Figure 3—figure supplement 6.

Purified protein fractions (His6-tagged Upa1 versions and GST-tagged MLLE domains of Pab1 and Rrm4) analysed by GST-pulldown assays as shown in Figure 3F. Coomassie-stained gels are shown in (A) and results of Western blot analysis in (B) using αHis and αGST antibodies.
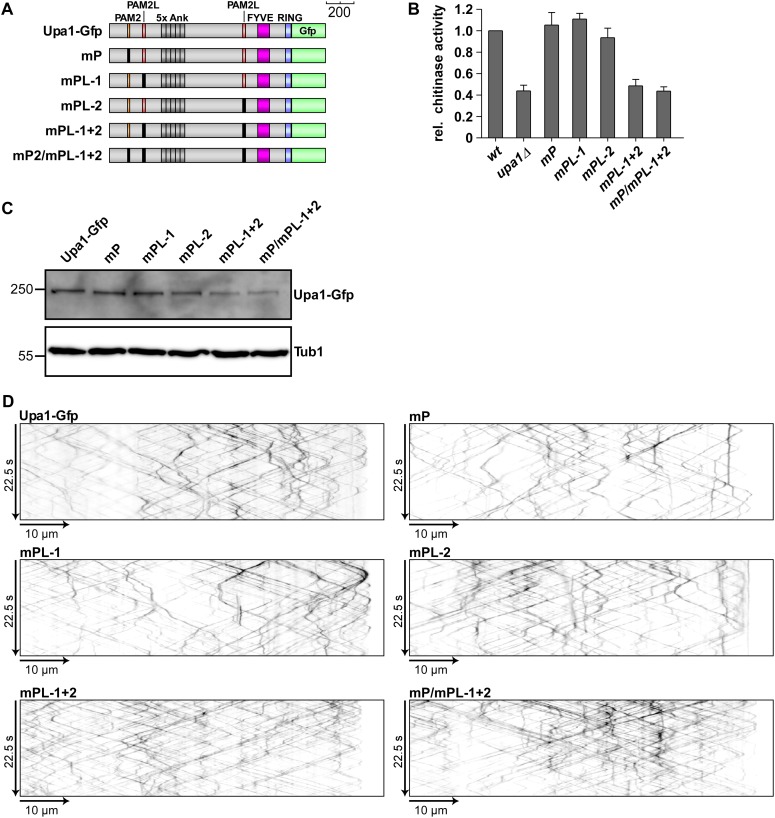
Figure 3—figure supplement 7. The PAM2L motifs are functionally important for efficient secretion of Cts1.

Figure 3—figure supplement 7.

(A) Schematic representation of Upa1 variants carrying mutations (black boxes) in the PAM2 and PAM2L regions. (B) Relative chitinase activity detecting endochitinase Cts1 (Koepke et al., 2011) in the hyphal form (error bars, s.e.m.; n = 3 independent experiments). (C) Western blot analysis of strains expressing Upa1-Gfp versions (depicted in A; α-Gfp antibodies were used for detection of Upa1 and detection of Tub1 served as control for equal protein amounts). (D) Kymographs of hyphae expressing Upa1-Gfp versions showing bidirectional movement of signals as diagonal lines and indicating that the mutations in the PAM2L motives did not cause drastic differences in endosomal movement of Upa1-Gfp versions.