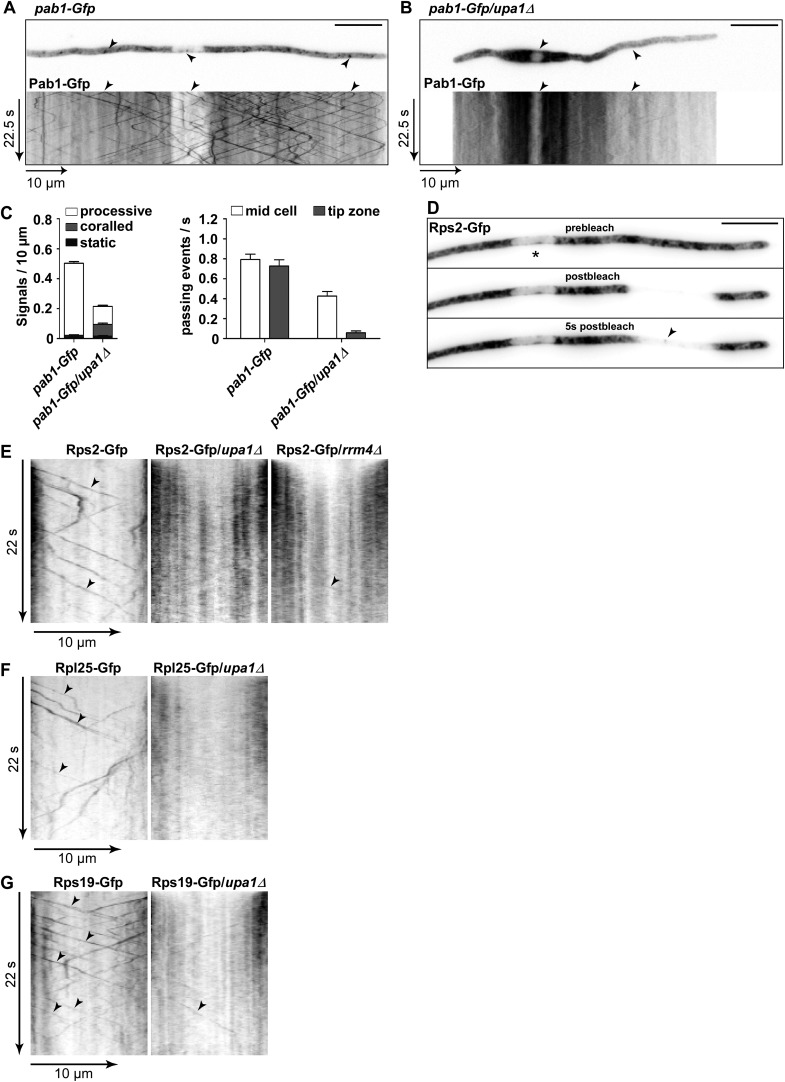
Figure 6. Upa1 functions specifically in mRNP function of endosomes.
(A, B) Micrographs (size bar, 10 μm) and corresponding kymographs (Videos 18, 19) of hyphae expressing Pab1-Gfp (A) or Pab1-Gfp/upa1Δ (B). (C) Bar diagrams depicting amount of Pab1-Gfp signals per 10 μm hyphae in wt and upa1Δ cells (left; error bars, s.d.; more than 13 hyphae) and number of Pab1-Gfp signals passing two zones in the middle of the hyphae and 10 μm from the apical pole in wt and upa1Δ cells (right; passages of signals/s, error bars, s.d.; >13 hyphae). (D) Analysing subcellular localisation of ribosomal protein Rps2-Gfp as an example. Micrographs (size bar, 10 μm) of hyphae expressing Rps2-Gfp (nucleus indicated by asterisk). 20-μm area was bleached by laser irradiation about 10 μm from the hyphal tip. Arrowhead indicates processive signal entering the bleached area. (E, F, G) Kymographs of hyphal areas bleached with laser irradiation, as shown in (D). Arrowheads indicate processive signals.

