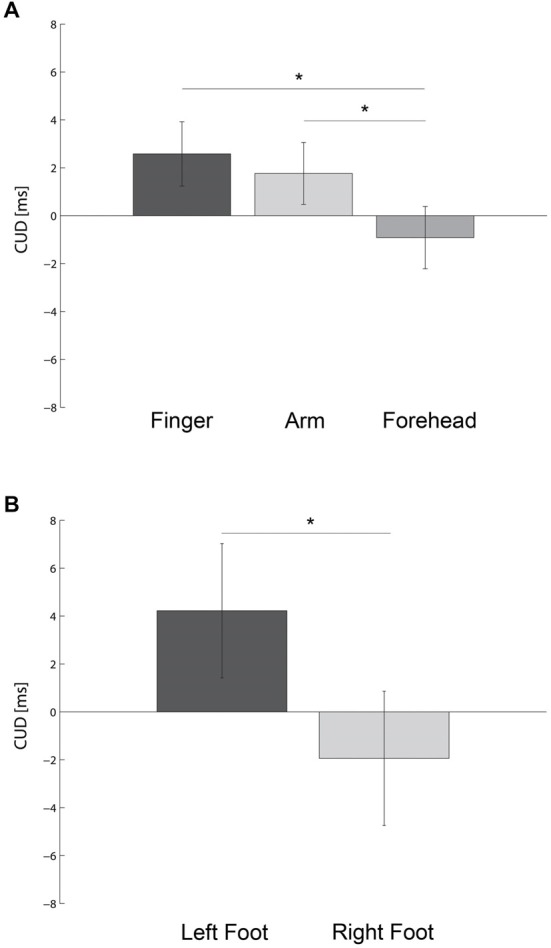
Figure 1.

Bar plots show the crossed-uncrossed difference (CUD) as a function of the body part stimulated (A) and foot used to respond (B). Error bars indicate the 95% Confidence Interval of the within participants variability (±CI). * denotes P < 0.05.
