
Figure 3.
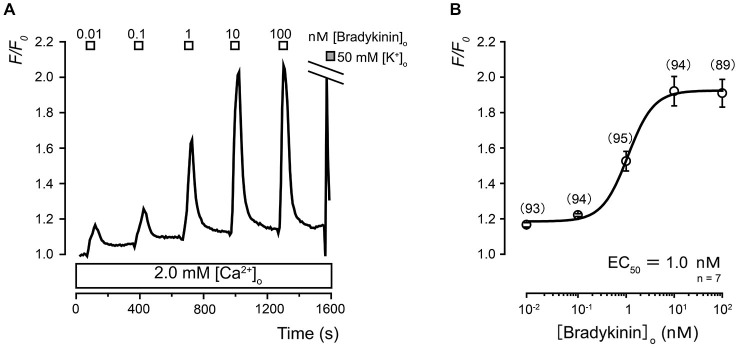
Ca2+ dependence of extracellular bradykinin (BK)-induced [Ca2+]i responses in TG neurons. (A) Examples of transient [Ca2+]i increases following the application of a series of BK concentrations. In the presence of extracellular Ca2+ (2.0 mM; lower white box), the application of BK induced transient [Ca2+]i increases in a concentration-dependent manner. The concentrations of BK (0.01–100 nM) that were administered are shown in the uppermost white boxes. (B) The data points illustrate the F/F0 values as a function of the applied BK concentration. Each data point represents the mean ± standard error (S.E.) of seven experiments (the numbers in parentheses represent the number of tested cells). The curve on the semilogarithmic scale was fitted according to Equation 1, which is described in the text. The upper gray box in (A) indicates the timing of the application of the 50 mM KCl solution. The equilibrium binding constant of BK was 1.0 nM.