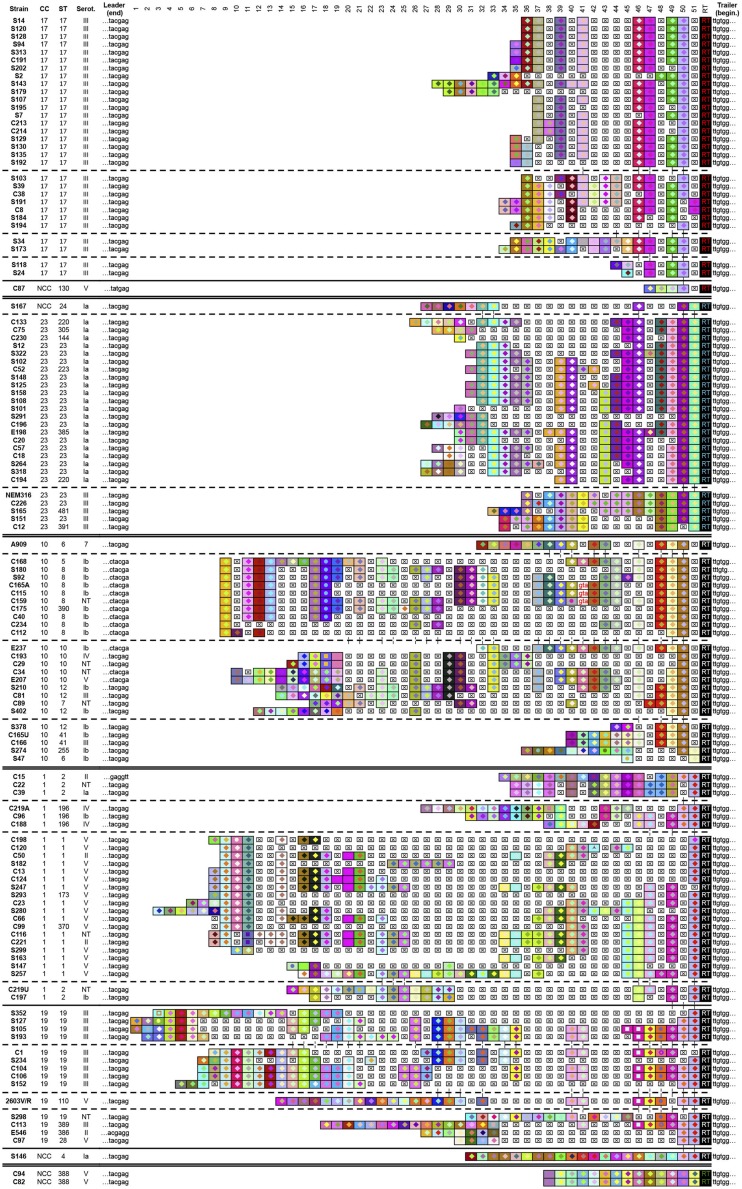
FIGURE 2.
Graphic representation of CRISPR1 loci for 126 S. agalactiae strains. Internal repeats are not included; only terminal repeats (RT), the leader and trailer end sequences (last six nucleotides and first six nucleotide, respectively) and spacers are represented. Each spacer is represented by a combination of one select character in a particular front color, on a particular background color. The color combination allows unique representation of a particular spacer, whereby squares with similar color schemes (combination of character color and background color) represent identical spacers, whereas different color combinations represent distinguishable spacers. Deleted spacers are represented by crossed squares. Strain names, clonal complexes (CC), sequence type (ST), and capsular serotype are given on the left. NCC indicates strains that do not belong to CC according to MLST. NT indicates strains that are not discriminated on the basis of the variability of capsular polysaccharides. Strains were arranged according to the CRISPR1 content. A double line separates CRISPR1 groups. Broken lines separate distinct subgroups in CRISPR1 groups and a continuous line separates NCC strains in CRISPR1 groups.

