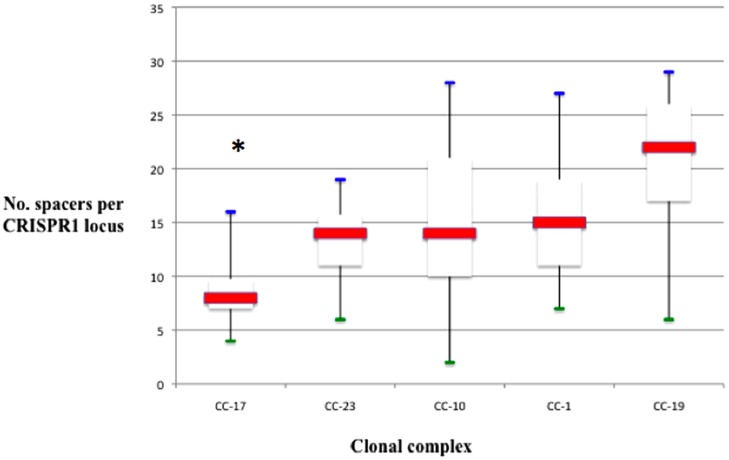
FIGURE 3.
Number of spacers per locus, represented in box plots, among different CC. The red line is the median. The lower end and the upper end of the rectangle represent the first and third quartile, respectively. The blue and green lines represent maximum and minimum values, respectively. The number of spacers in locus CRISPR1 was significantly lower for strains belonging to CC-17 than for others CC (*p < 0.001).

