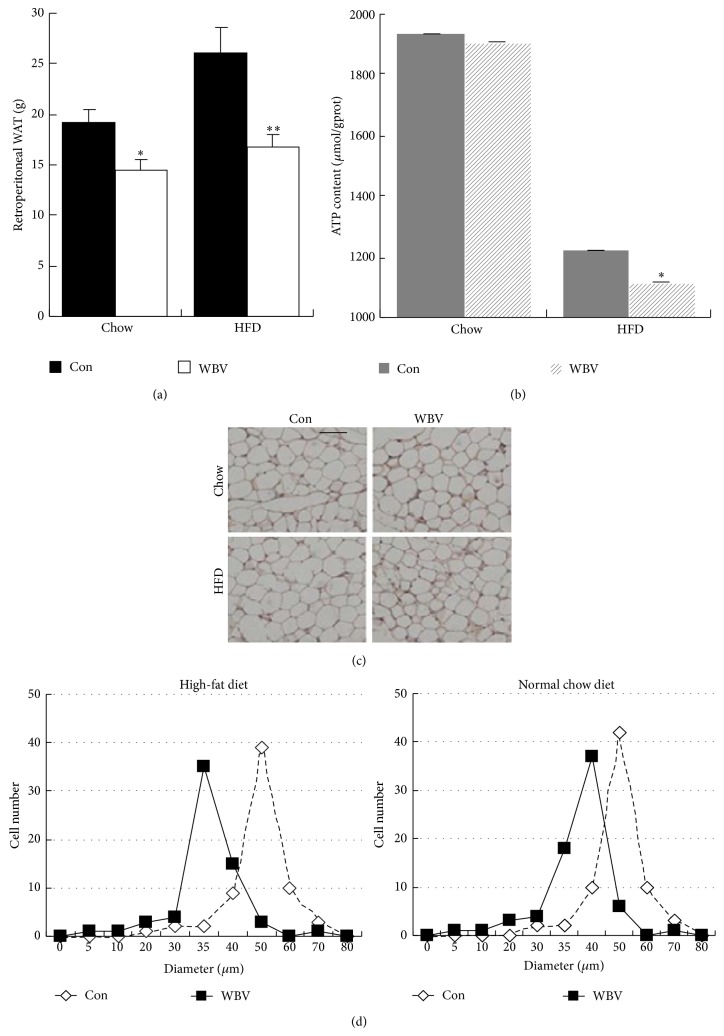
Figure 3.
Morphology change in retroperitoneal WAT. (a) The weight of BAT in the different groups (n = 6). (b) ATP content in rat BAT (n = 6). (c) H&E staining of WAT (scale bar = 40 μm, magnification, ×400). (d) Quantification of adipocyte diameter of retroperitoneal WAT from rats in the different groups (data were collected from H&E-stained sections from three individual rats, five fields per rat, and 10–15 cells per field in each group, using Image J software). Data was expressed as mean ± SEM. ∗ P < 0.05 versus control group.

