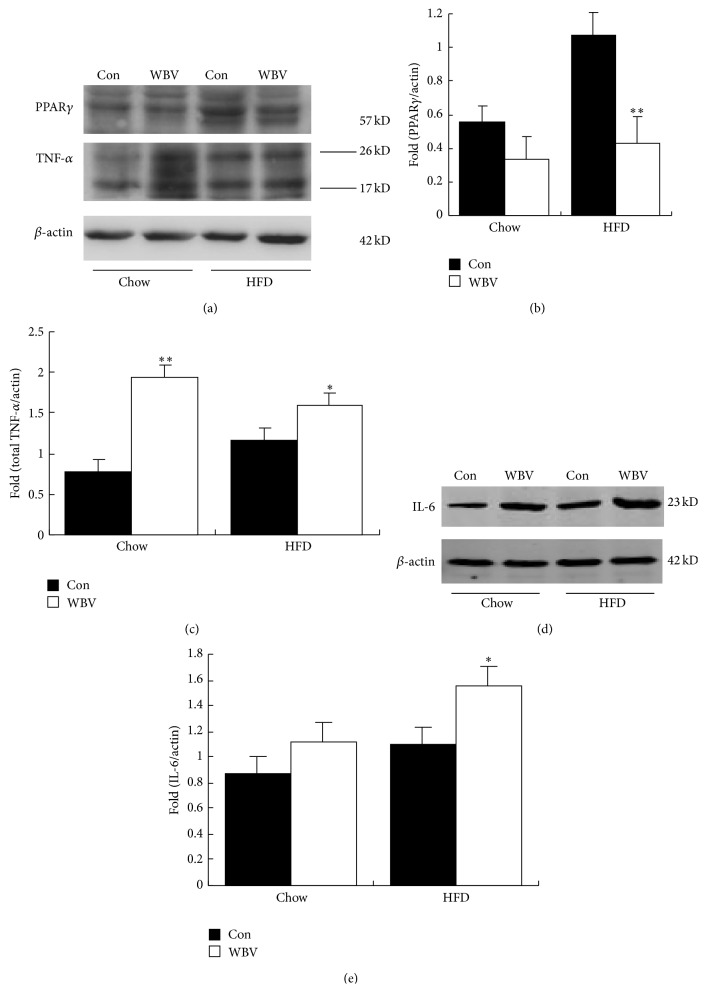
Figure 5.
Protein expression of PPARγ, IL-6, and TNF-α in WAT after vibration for 8 weeks. (a) Western blot analysis of PPARγ and TNF-α in rat BAT. (b) PPARγ protein content is normalized to β-actin protein content. (c) Total TNF-α protein content (26 KD and 17 KD) is normalized to β-actin protein content. (d) Western blot analysis of IL-6 in rat BAT. (e) IL-6 protein content is normalized to β-actin protein content. Values are means ± SEM; n = 3. ∗ P < 0.05 and ∗∗ P < 0.01 versus control group.

