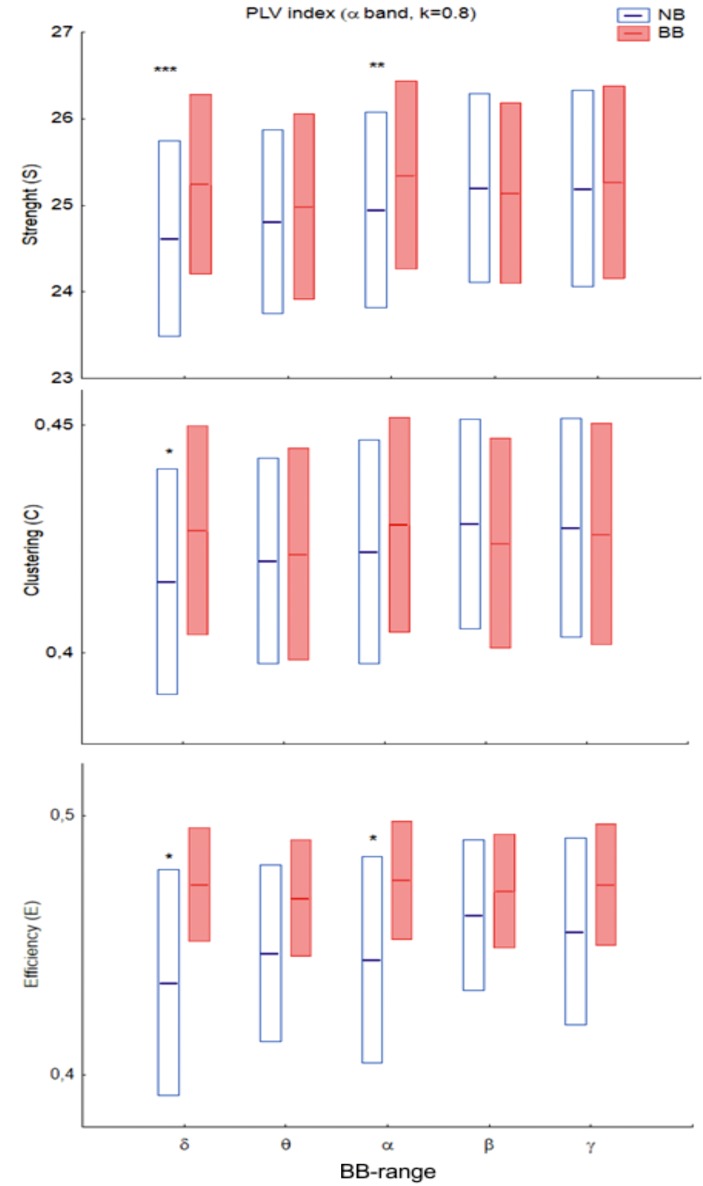
Fig 2. Global strength (S, top), clustering (C, middle) and efficiency (E, bottom) for the PLV brain network in the EEG alpha band (k = 0.8) for the different BB frequency ranges.
Bars indicate 95% confidence interval for the mean. Blue: Non-binaural (NB) beat; red: Binaural (BB) beat. For all the indices, there was a significant interaction between the (R)ange and (B)eat factors (see Results for F and p values, as well as Table 1). Asterisks stand for BB-NB, differences: *: p<0.05; **: p<0.01; ***: p<0.001.

