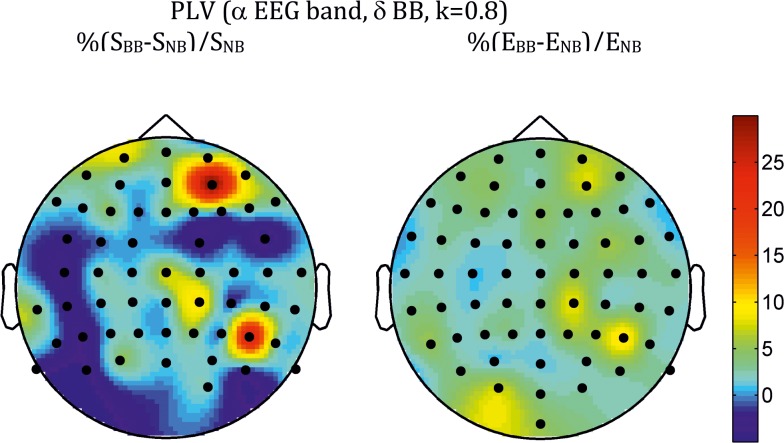
Fig 4. Average across all subjects of the topographic distribution of differences in strength (S, left) and efficiency (E, right) between BB and NB for the PLV index (alpha EEG band, k = 0.8, delta-BB).
Bullets indicate the position of electrodes for which differences were significant at the q < 0.1 level (FDR type I) using a paired t-test.

