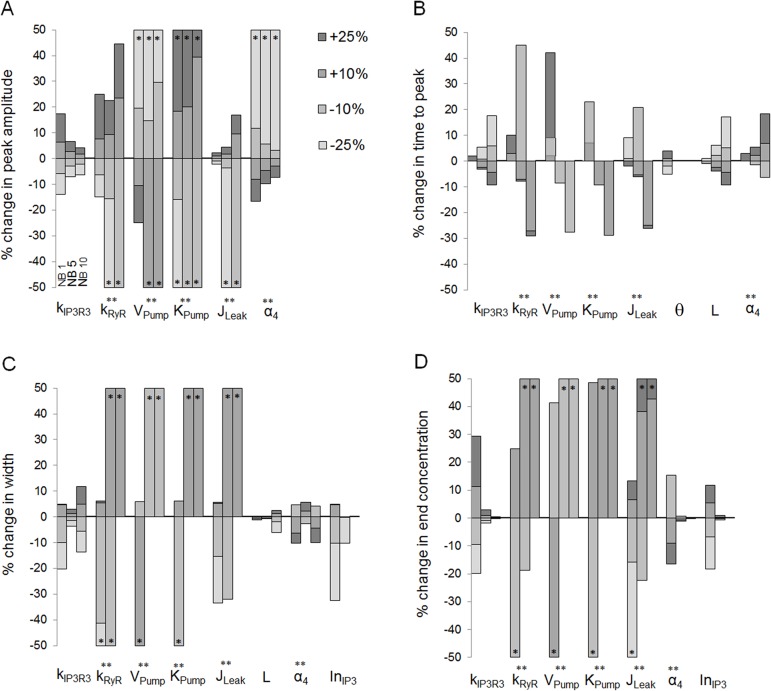
Fig 6. Sensitivity analysis of the model parameters.
Percentage changes in Ca2+ wave (A) peak amplitude, (B) time to peak, (C) Ca2+ wave width at half maximum, and (D) end Ca2+ concentration at 90 seconds’ time point due to changes in model parameters , kRyR, VPump, KPump, JLeak, θ, L, α4, , , , and as marked in the x-axis. The analysis was carried out in NB layers NB1, NB5 and NB10 as denoted in (A) for parameter . The amount of modification (-25%, -10%, +10% or +25%) is shown in the grayscale of the histogram. The histogram bar is marked with asterisk (*) if the change was greater than 50%, and with double asterisk (**) if parameter modification did not result typical Ca2+ waveform. Regarding each Ca2+ wave feature, the parameter is illustrated only if the change was more than 5%.

