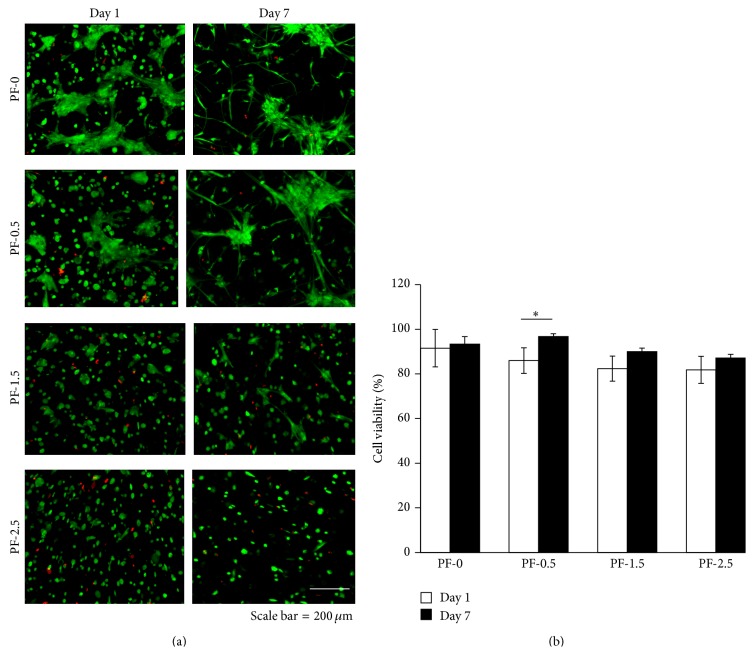
Figure 2.
Cytocompatibility of PF hydrogels (PF-0, PF-0.5, PF-1.5, and PF-2.5) as a function of degree of cross-linking after 1 and 7 days of culture. (a) Representative live/dead images of DPSC-laden PF hydrogels at days 1 and 7 of culture, with live cells stained green and dead cells shown in red (n = 3/group/time point; scale bar = 200 μm). (b) Percentage of cell viability of DPSCs at days 1 and 7 of culture. Mean ± SD: n = 3, 2-3 images/gel sample. * P < 0.05, Fisher's post hoc test.

