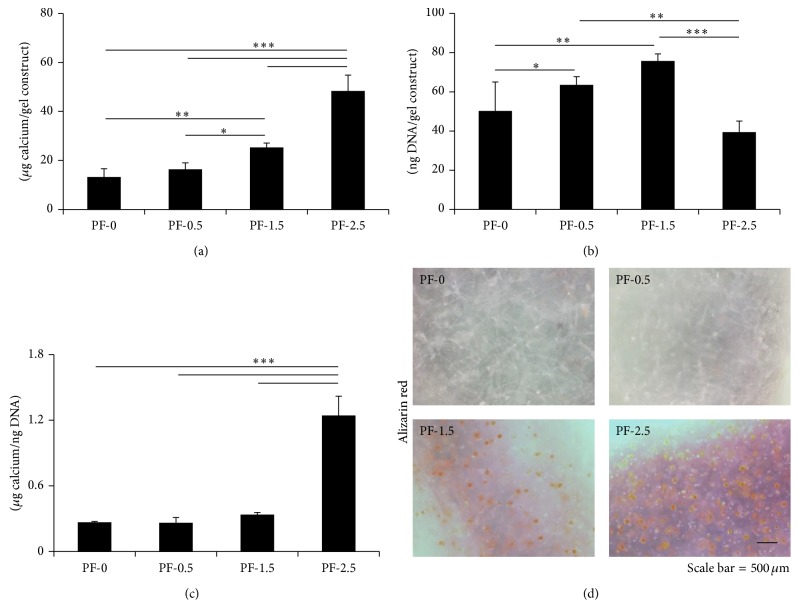
Figure 5.
Calcium quantification of encapsulated DPSCs in PF hydrogels (PF-0, PF-0.5, PF-1.5, and PF-2.5) as a function of degree of cross-linking after 21 days of culture. (a) Total calcium content per gel construct. (b) DNA content per gel construct. (c) Calcium content per cell based on the amount of calcium normalized by the DNA content in the construct. Mean ± SD: n = 3. (d) Alizarin red staining of the DPSC-laden gel constructs. Red color indicates calcium deposition. Scale bar = 500 μm. * P < 0.05, ** P < 0.01, and *** P < 0.001, Fisher's post hoc test.

